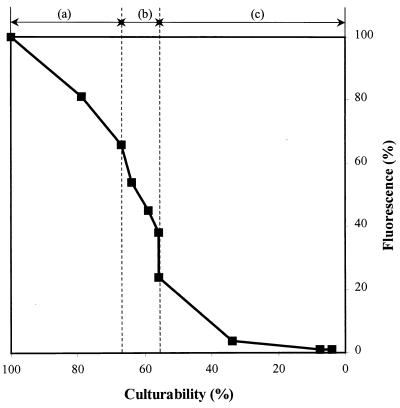
FIG. 3.
Relationship between culturability and Nile red fluorescence during starvation. Days zero to 5 (a), 6 to 56 (b), and 57 to 600 (c) following incubation in tap water are shown. Fluorescence and culturability data from Fig. 2 were expressed as percentages of their respective values at day zero to illustrate the relationship between PHB utilization and loss of culturability during starvation.

