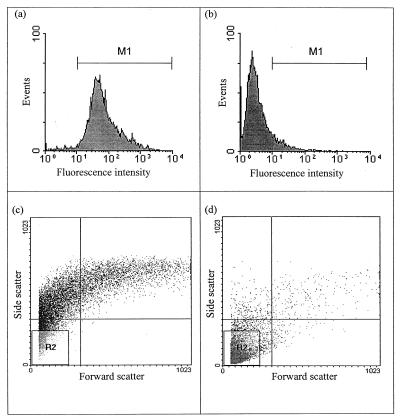
FIG. 4.
Changes in cellular fluorescence and population distribution during starvation as detected by flow cytometry. The histogram plots (a and b) illustrate the fluorescence intensities recorded at 580 ± 25 nm for samples collected at day zero (a) and after 490 days of starvation (b). The dot plots (c and d) illustrate the relative cell complexities and size distributions (side scatter is representative of relative complexity and granularity; forward scatter is representative of relative cell length) for samples collected at day zero (c) and day 490 (d). All plots are based on the analysis of 10,000 events.

