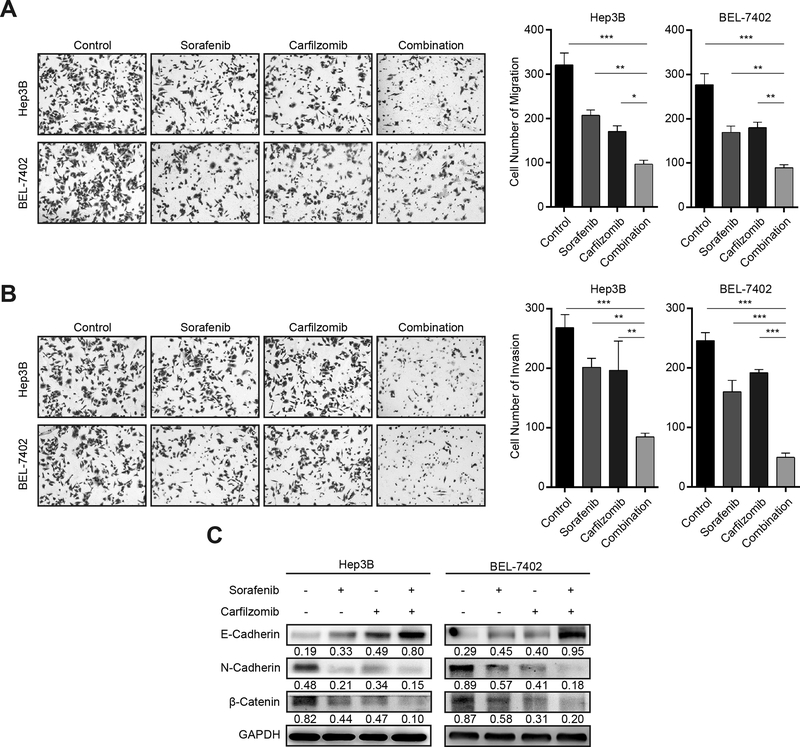
Figure 4. Carfilzomib and sorafenib inhibit HCC cell migration, invasion and EMT.
(A) Hep3B and Bel-7402 cells were treated with carfilzomib (0.05 μM) and sorafenib (7.5 μM) individually or in combination for 24 h. Transwell migration assays were performed to determine the migratory ability of Hep3B and Bel-7402 cells. The experiments were performed in triplicate and data represent mean ± SD. *p < 0.05, ** p < 0.01, ***p < 0.001.
(B) Hep3B and Bel-7402 cells were treated with carfilzomib (0.05 μM) and sorafenib (7.5 μM) individually or in combination for 24 h. Transwell invasion assays were performed in metrigel to determine the invasion ability of Hep3B and Bel-7402 cells. The experiments were performed in triplicate and data represent mean ± SD. *p < 0.05, ** p < 0.01, ***p < 0.001
(C) Hep3B and Bel-7402 cells were treated with carfilzomib (0.05 μM) and sorafenib (7.5 μM) individually or in combination for 24 h. The expression of the epithelial marker E-cadherin, and the mesenchymal markers N-Cadherin and β-Catenin was analyzed by immunoblot. GAPDH was used as a loading control. Number indicates relative abundance (arbitrary unit).

