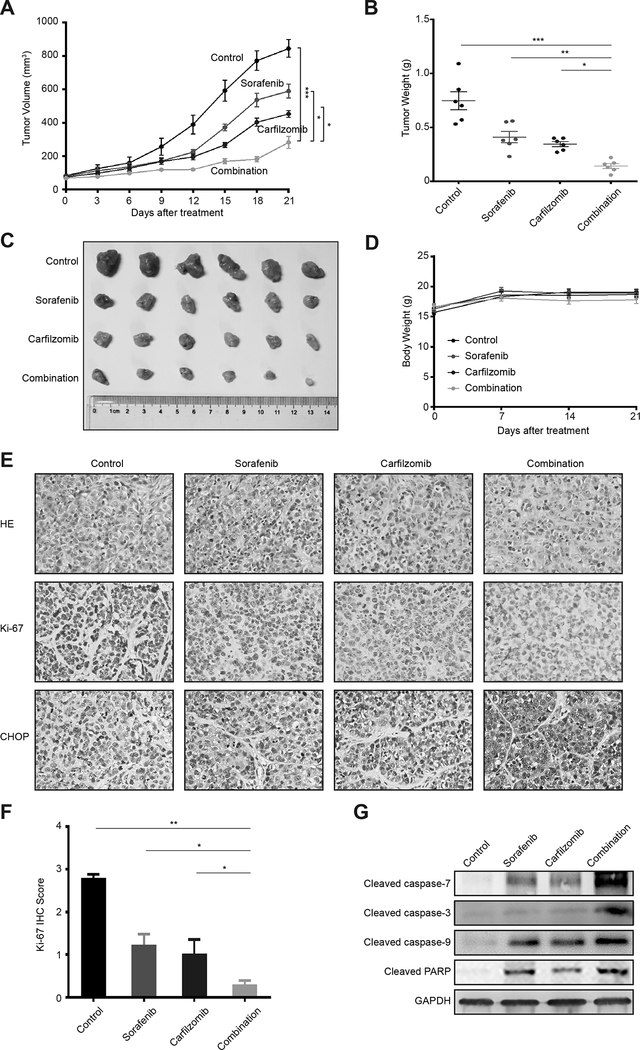
Figure 5. Carfilzomib and sorafenib strongly attenuate HCC tumor growth in vivo.
(A) Xenograft tumors generated from Hep3B cells were treated with carfilzomib and sorafenib individually or in combination, or with a drug vehicle control. Growth of xenograft tumors was measured by tumor volume. Data represent mean ± SD (n = 6). Statistical analyses were performed by two-way ANOVA and sample-paired t-test. *p < 0.05, ** p < 0.01, ***p < 0.001.
(B, C) Shown are the weights and images of xenograt tumors at the end of the experiment. Data represent mean ± SD (n = 6). Statistical analyses were performed by one-way ANOVA and sample-paired t-test. *p < 0.05, ** p < 0.01, ***p < 0.001.
(D) The body weight +/− SD of mice in different treatment groups.
(E) Upper panel: Representative images of HE staining of HCC xenografted tumor sections in different treatment groups (200 × magnification); Lower panel: Representative images of Ki67 staining of HCC xenografted tumor sections in different treatment groups (200 × magnification).
(F) Quantification of IHC scores for Ki-67 staining in Hep3B xenograft tumors. Data represent mean ± SD (n = 6). Statistical analysis was performed by sample-paired t-test. *p < 0.05, ** p < 0.01, ***p < 0.001.
(G) Xenograft tumor tissues from different drug treatment groups were analyzed for cleaved caspase-3, cleaved caspase-7, cleaved caspase-9 and cleaved PARP by immunoblot. GAPDH was used as a loading control.

