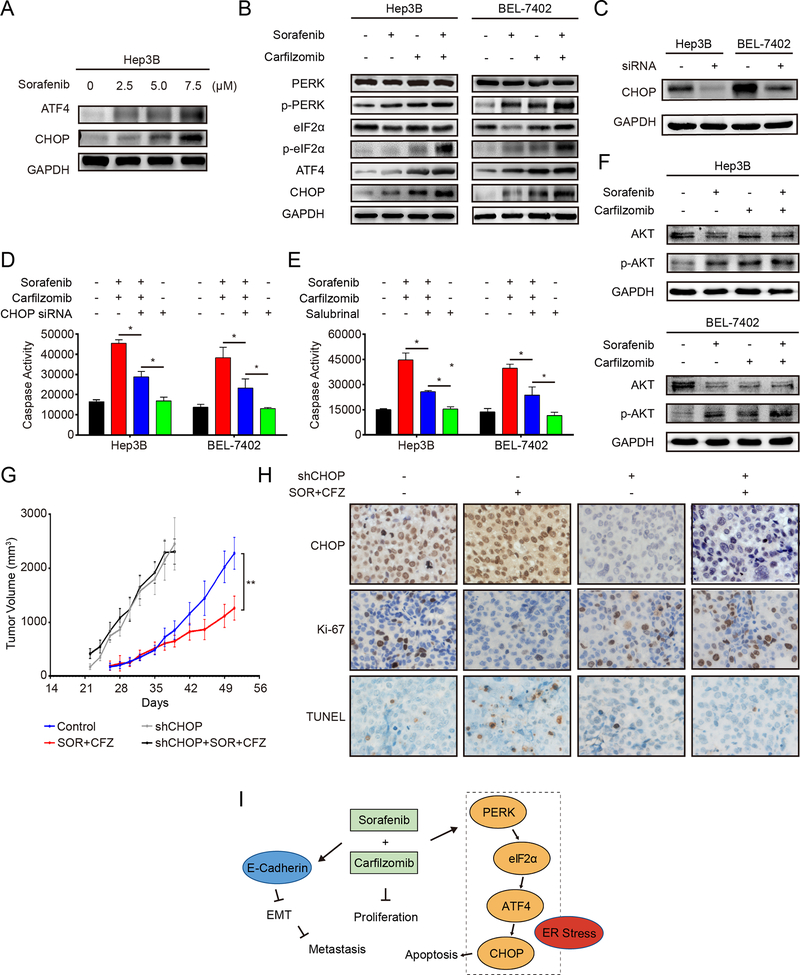
Figure 6. Carfilzomib and sorafenib treatments trigger ER stress-mediated apoptosis through the PERK/eIF2α/ATF4/CHOP pathway.
(A) Hep3B cells were treated with different concentrations of sorafenib (2.5, 5.0, 7.5 μM) for 24 h. The expression of ATF4 and CHOP was analyzed by immunoblot. GAPDH was used as a loading control.
(B) Hep3B and Bel-7402 cells were treated with carfilzomib (0.1 μM) and sorafenib (7.5 μM) individually or in combination for 24 h. Activation of the PERK/eIF2α/ATF4/CHOP pathway was analyzed by the expression of various marker proteins of the pathway by immunoblot.
(C) Shown is the knockdown efficiency of CHOP by siRNA as determined by immunoblot in Hep3B and Bel-7402 cells.
(D) Knockdown of CHOP decreases the activity of caspase-3/7 induced by carfilzomib and sorafenib. Hep3B and Bel-7402 cells were transfected with CHOP siRNA for 48 h before treated with carfilzomib (0.1 μM) and sorafenib (7.5 μM) individually or in combination for another 24 h. The activity of caspase-3/7 was determined by the Caspase-Glo assay. The experiments were performed in triplicate and data represent mean ± SD. *p < 0.05.
(E) Salubrinal suppressed caspase-3/7 activities induced by carfilzomib and sorafenib. Hep3B and Bel-7402 cells were pretreated with salubrinal (20 μM) for 12 h before treated with carfilzomib (0.1 μM) and sorafenib (7.5 μM) individually or in combination for another 24 h. The activity of caspase-3/7 was determined by the Caspase-Glo assay. The experiments were performed in triplicate and data represent mean ± SD. * p < 0.05.
(F) Hep3B and Bel-7402 cells were treated with carfilzomib (0.1 μM) and sorafenib (7.5 μM) individually or in combination for 24 h. Protein levels of p-AKT and AKT were analyzed by immunoblot.
(G) Xenograft tumors generated from Hep3B cells expressing shCHOP or control shRNA were treated with combined carfilzomib/ sorafenib or a drug vehicle. Growth of xenograft tumors was measured by tumor volume. Data represent mean ± SD (n = 8). Statistical analyses were performed by two-way ANOVA and sample-paired t-test. ** p < 0.01.
(H) Representative images of IHC staining for CHOP (upper panels), Ki67 (middle panels) and TUNEL (lower panels) in HCC xenograft tumor sections in different treatment groups (400 × magnification).
(I) A working model illustrating the inhibitory mechanism of carfilzomib and sorafenib against HCC.

