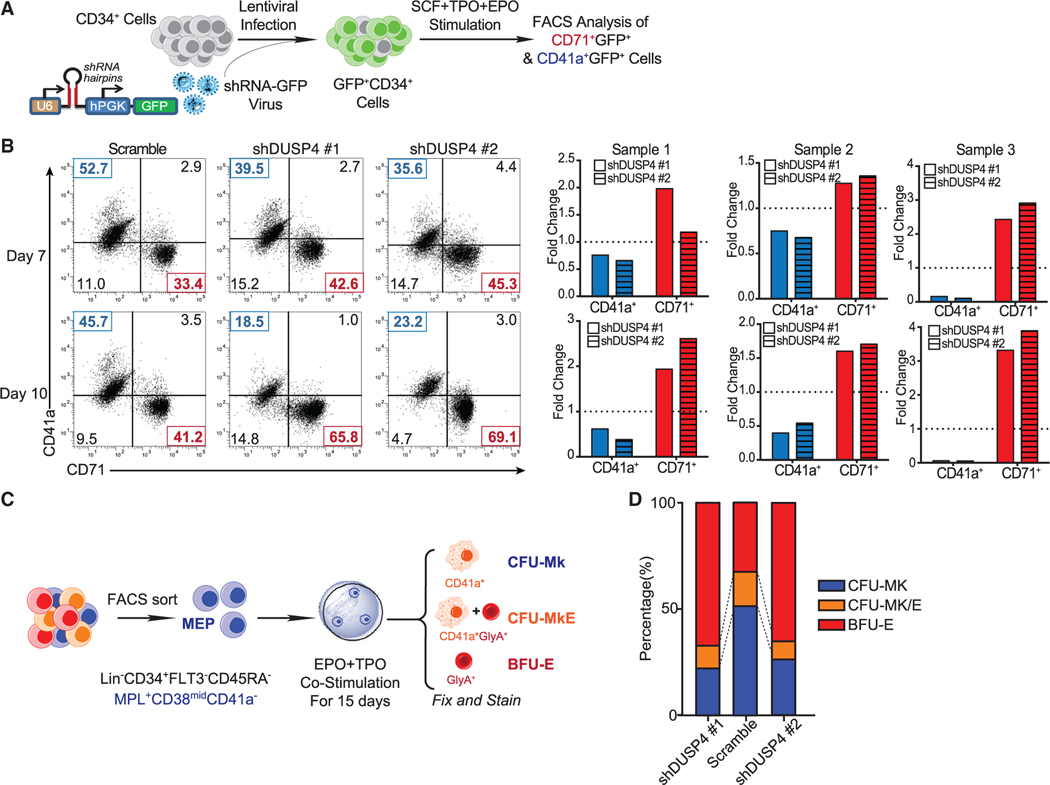
Figure 2. DUSP4-regulated differentiation choices between Mk cells and Er cells.
(A) Schematic of differentiation experiments using CB CD34+ cells.
(B) FACS analysis of CD41a and CD71 on the cultured cells. Representative plots (top panel) and normalized statistics of three samples (bottom panel) are shown (n = 3, independent experiments). Fold changes were normalized with scramble controls.
(C) Schematic description of colony-forming unit (CFU) assays using MEP.
(D) Percentages of CFU-Mk, BFU-E, and CFU-MkE in each sorted population (n = 2, independent experiments).

