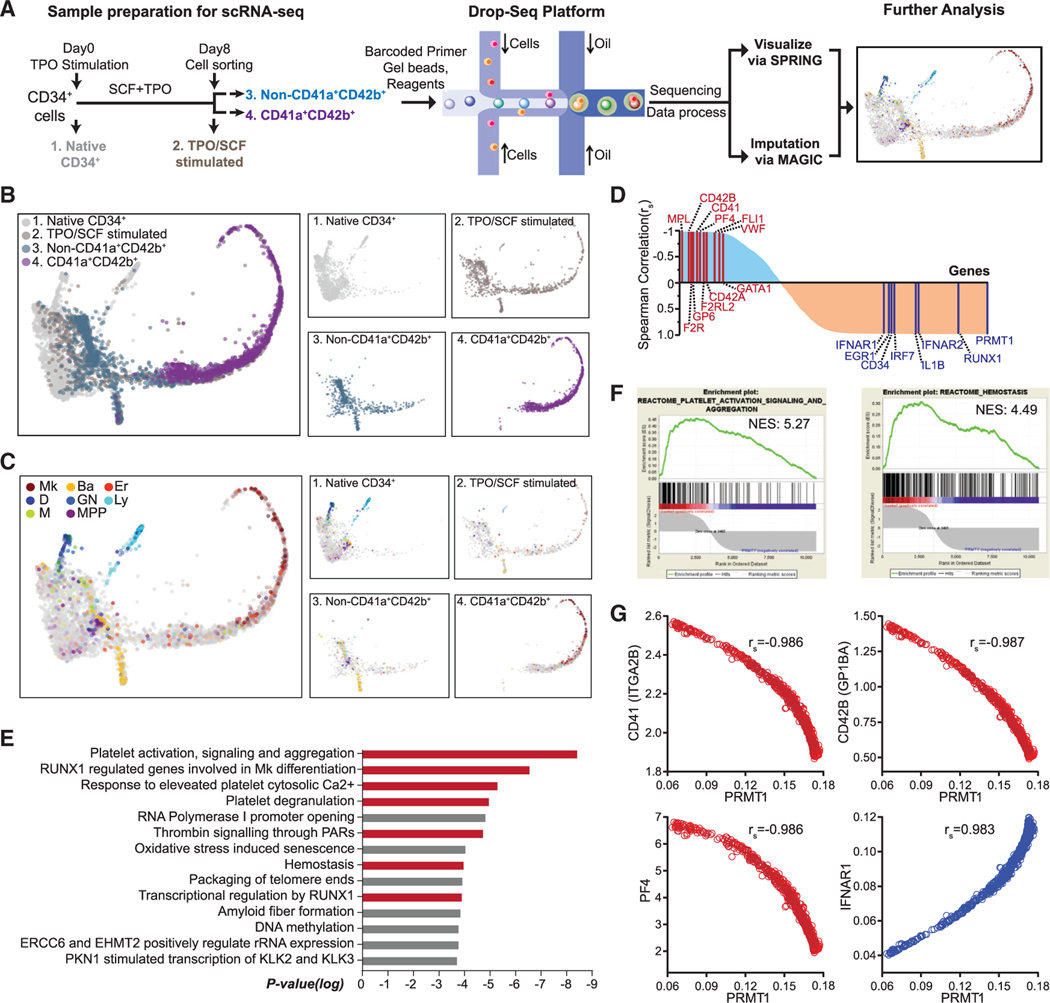
Figure 4. Negative correlation between PRMT1 and Mk differentiation revealed by single-cell RNA-seq (scRNA-seq) analysis.
(A) Experimental design for scRNA-seq analysis. Sample 1: Native CD34+ cells were cells isolated directly from BM. Sample 2: CD34+ cells were cells cultured in TPO and SCF for 8 days before sorting with CD41a and CD42b. Sample 3: The non-CD41a+CD42b+ cells were sorted from sample 2. Sample 4: The CD41a+CD42b+ cells were sorted from sample 2.
(B and C) SPRING plots of single-cell transcriptomes. Individual cells are presented according to their origins (B) or transcriptome-associated cell types (C). Ba, basophilic or mast cell; D, dendritic; Er, erythroid; GN, granulocytic neutrophil; Ly, lymphocytic; M, monocytic; Mk, megakaryocytic; MPP, multipotential progenitor.
(D) Pathway analysis of the top 400 genes with the strongest negative Spearman correlation to PRMT1 expression level in the TPO/SCF-stimulated CD41a+CD42b+ population. Red bars highlight Mk-relevant biological pathways.
(E) Spearman correlation coefficients between PRMT1 and any gene revealed by scRNA-seq in TPO/SCF-stimulated CD41a+CD42b+ cells. Representative genes with significant correlation and functional relevance are annotated.
(F) Gene set enrichment analysis (GSEA) of PRMT1-correlated genes in the TPO/SCF-stimulated CD41a+CD42b+ population. GSEA inputs are Spearman correlation coefficients of PRMT1 versus any gene with single-cell resolution.
(G) Normalized expression of representative transcripts co-plotted against that of PRMT1 transcript in TPO/SCF-stimulated CD41a+CD42b+ cells with single-cell resolution.

