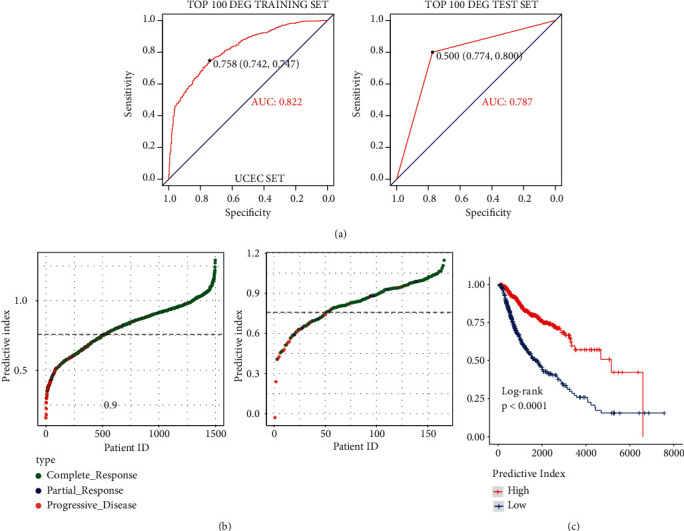
Figure 7.

ROC curve, predictor chart, and overall survival rate chart of reactive tumor and progressive disease tumor after logistic regression. (a) ROC curve. (b) The ordinate is sorted from small to large according to the prediction index, and the threshold is 0.758. (c) Overall survival curve.
