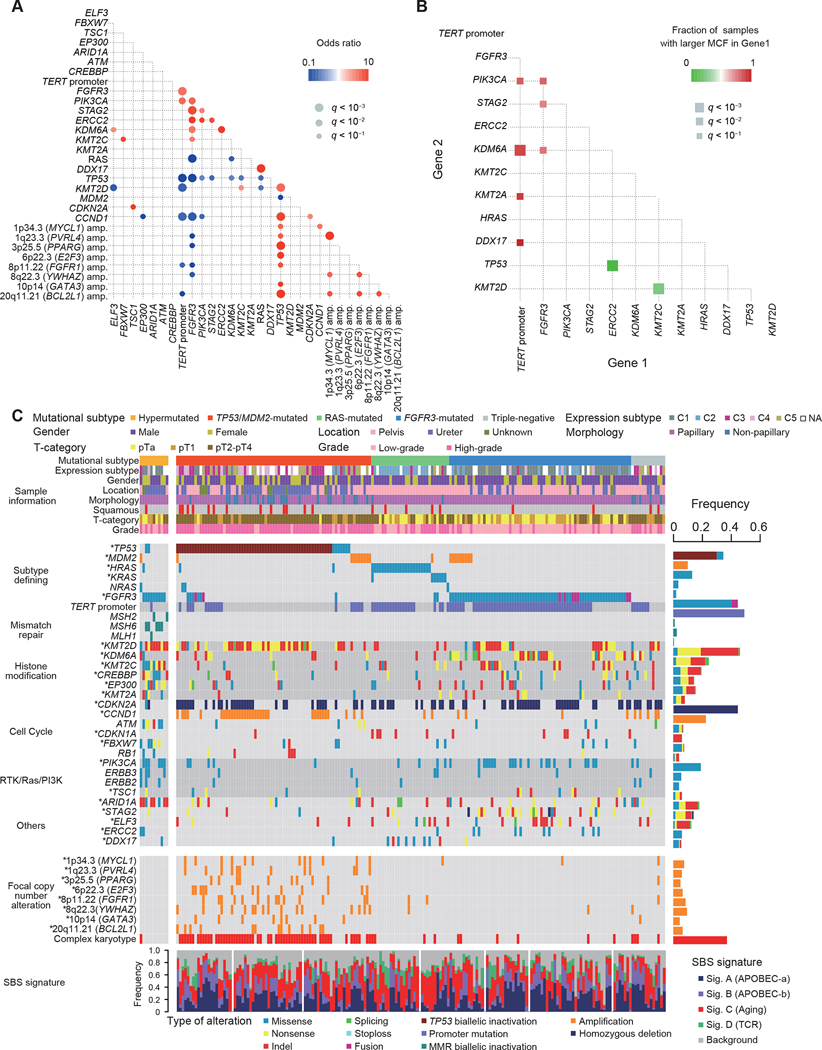
Figure 2. Unique Molecular subtypes of UTUC.
(A) Statistically significant (q < 0.1) positive (red) and negative (blue) correlations across common genetic lesions in non-hypermutated UTUC (Fisher’s exact test with Benjamini-Hochberg adjustment). (B) Statistically significant (q < 0.1, two-sided Fisher’s exact test with Benjamini-Hochberg adjustment) pairwise comparison of difference in MCFs between indicated gene pairs. (C) Landscape of somatic alterations in 199 UTUC cases grouped into five discrete subtypes. Significantly mutated (MutSigCV) and/or positively selected (dNdScv) driver genes are indicated by asterisks. At the bottom are SBS signatures. RTK, receptor tyrosine kinase; PI3K, phosphatidylinositol 3-kinase.

