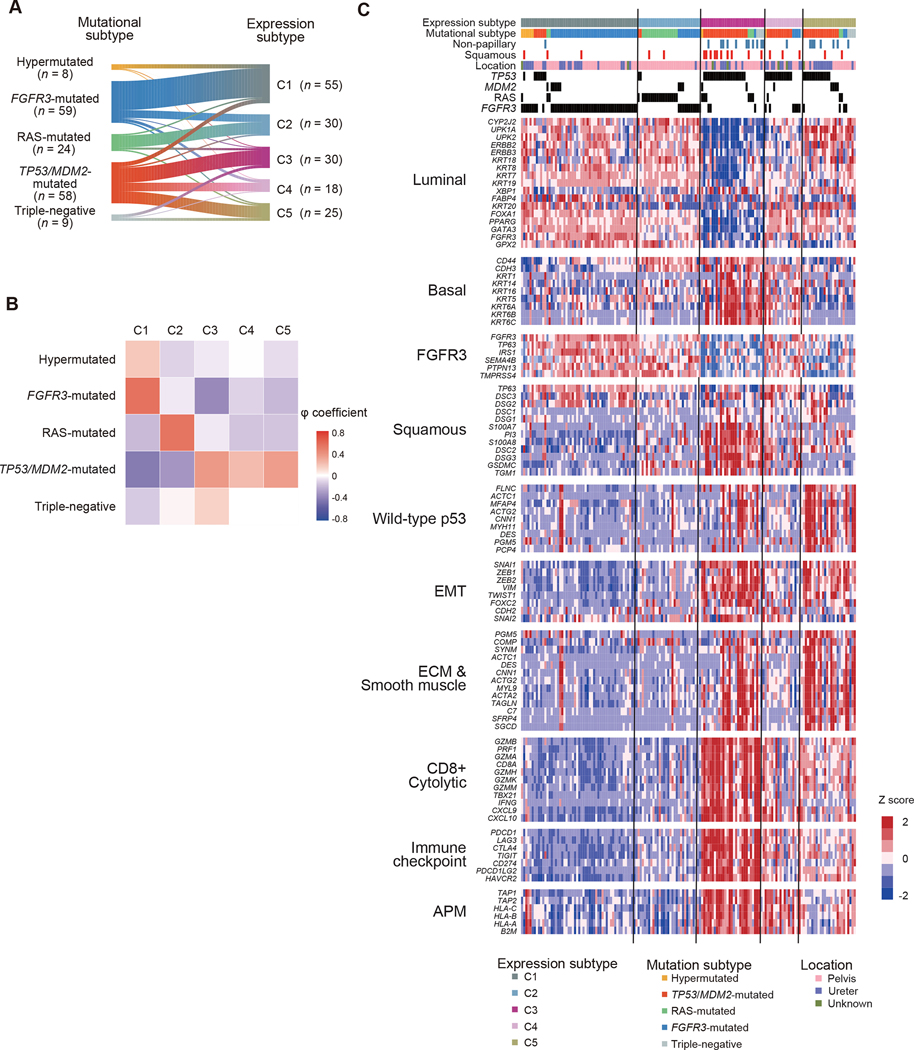
Figure 4. Expression profiles of UTUC.
(A-B) Correlations (A) and phi coefficients (B) between mutational and expression subtypes in 158 UTUC cases in which both mutations and gene expression were analyzed. (C) Expression profiles of indicated gene pathways of biological relevance implicated in UBC. EMT, epithelial mesenchymal transition; ECM, extracellular matrix; APM, antigen presentation machinery.

