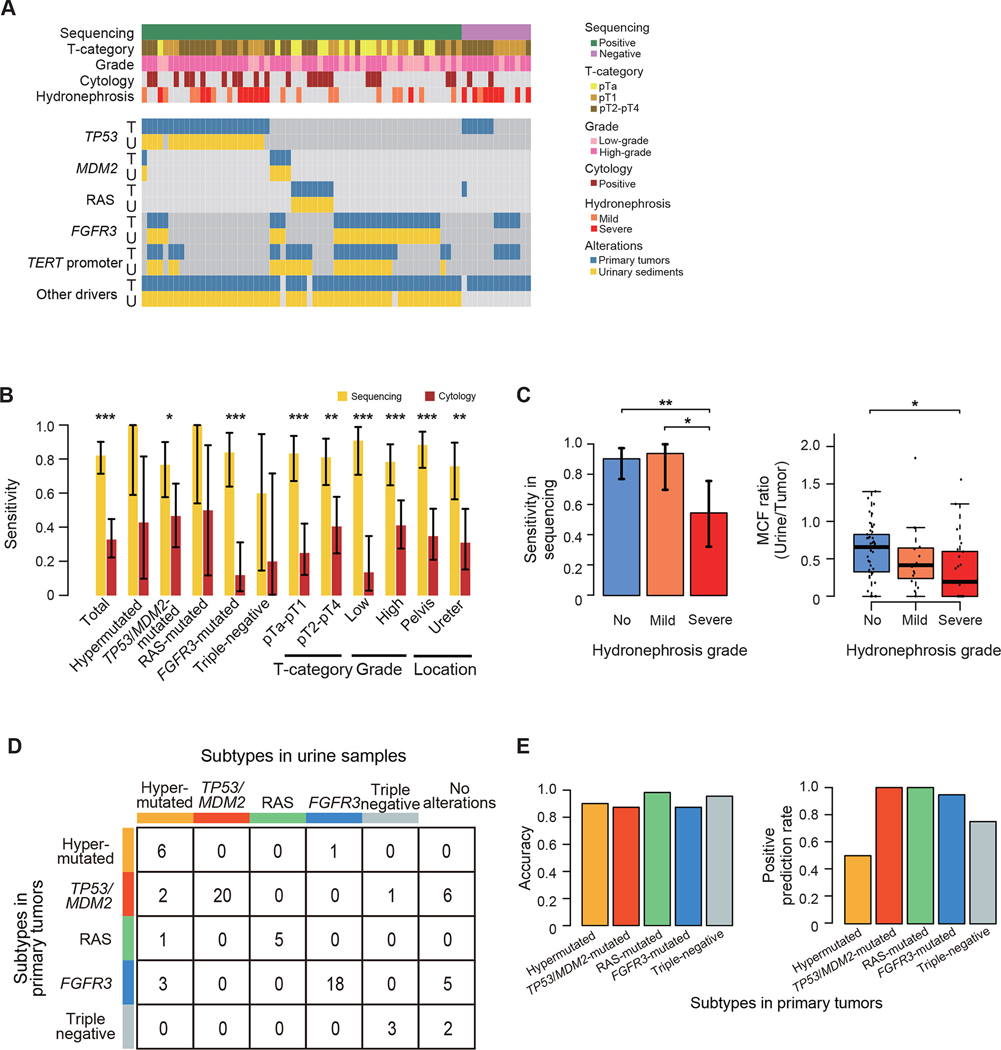
Figure 6. Urinary sediment-derived DNA sequencing.
(A) Mutation profiles of paired samples of primary tumors and corresponding preoperative voided urinary sediments (n=73). The columns represent samples, and the rows represent genomic lesions in primary tumors (indicated by “T”) and preoperative urinary sediment (indicated by “U”). (B) Sensitivity of urinary sediment-derived DNA sequencing (yellow) and urinary cytology (brown) according to mutational subtypes and clinical/pathological features with 95% CI error bars. P values calculated by two-sided Fisher’s exact test. *P < 0.05, **P < 0.01, ***P < 0.001. (C) Bar plots showing the sensitivity of urinary sediment-derived DNA sequencing with 95% CI error bars (left) and box plots showing MCF ratios of preoperative urinary sediment samples and corresponding primary tumors (right) according to the severity of hydronephrosis. P values calculated by two-sided Fisher’s exact test and two-sided Mann-Whitney U test with Bonferroni correction, respectively. The median, first and third quartiles, as well as outliers, are indicated with whiskers extending to the furthest value within 1.5 of the interquartile range in box plots. *P < 0.05, **P < 0.01. (D) Summary of mutational subtypes prediction based on the results in urinary sediment-derived DNA sequencing. (E) Bar plots showing the accuracy (left) and positive prediction rate (right) in each subtype.

