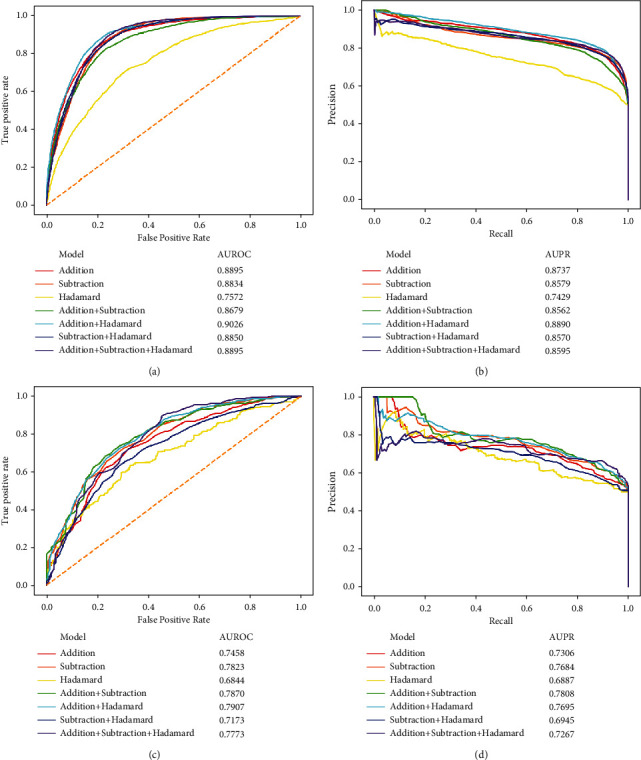
Figure 4.

Performance of the classifiers using different combinations of feature types under the composition tenfold cross-validation evaluated by ROC and PR curves. (a) The ROC curves on the ODIT test dataset. (b) The PR curves on the ODIT test dataset. (c) ROC curves on the NDIT test dataset. (d) The PR curves on the NDIT test dataset.
