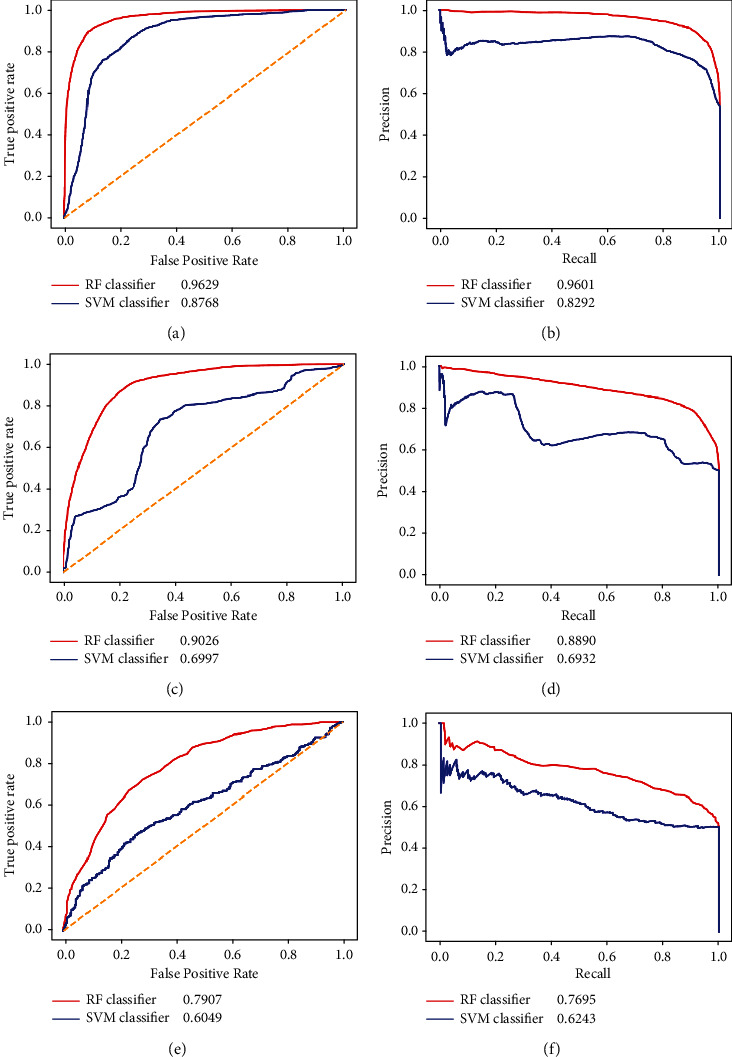
Figure 5.

Performance of the RF and SVM classifiers under two types of tenfold cross-validation evaluated by ROC and PR curves. (a) The ROC curve under the entire tenfold cross-validation. (b) The PR curve under the entire tenfold cross-validation. (c) The ROC curve on the ODIT test dataset under the composition tenfold cross-validation. (d) The PR curve on the ODIT test dataset under the composition tenfold cross-validation. (e) The ROC curve on the NDIT test dataset under the composition tenfold cross-validation. (f) The PR curve on the NDIT test dataset under the composition tenfold cross-validation.
