Figure 4.

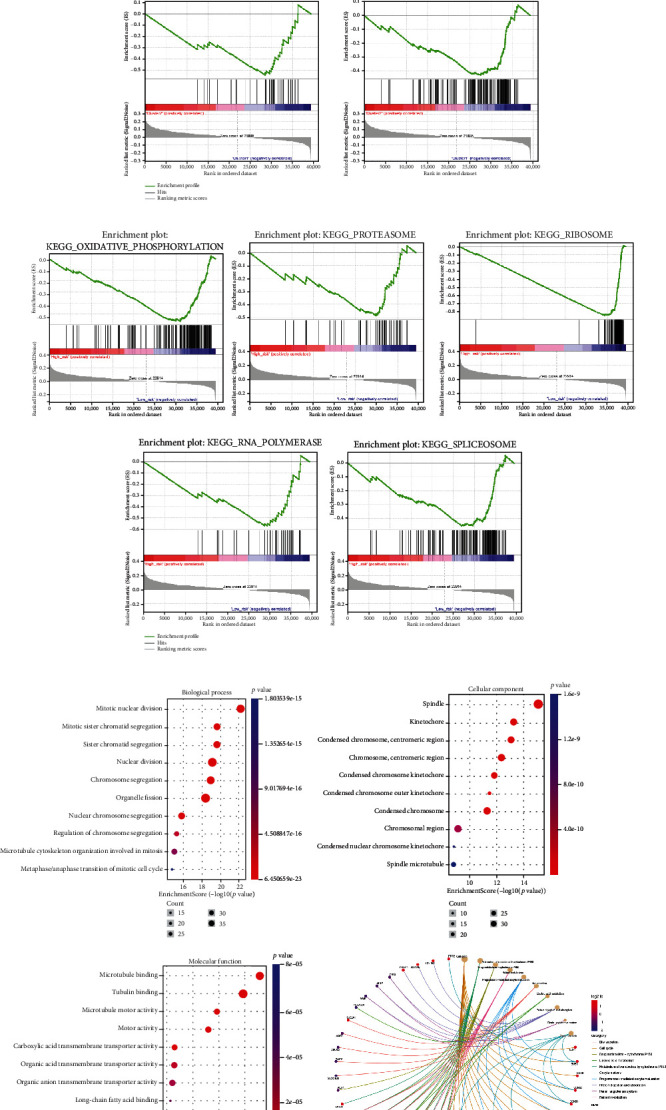
GSEA and GO enrichment analysis. (a) GSEA analysis in cluster1/2. (b) GSEA analysis for the high- and low-risk groups. (c) GO enrichment analysis for the common target genes of miR-210-3p and miR-106a-5p.

GSEA and GO enrichment analysis. (a) GSEA analysis in cluster1/2. (b) GSEA analysis for the high- and low-risk groups. (c) GO enrichment analysis for the common target genes of miR-210-3p and miR-106a-5p.