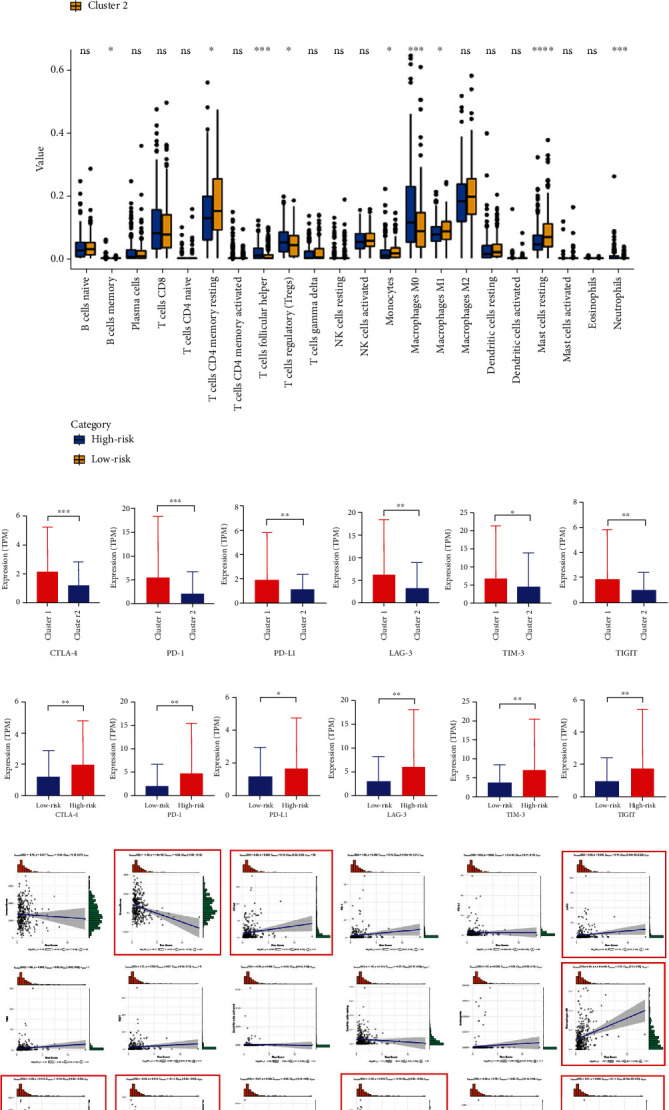
Figure 5.

The correction between TIME and ROS score. (a, b) The expression of 22 immune cells in cluster1/2 and high/low-risk groups. (c, d) The expression of six immune markers in cluster1/2 and high/low-risk groups. (e) The correlation between TIME and ROS score. ∗p < 0.05, ∗∗p < 0.01, ∗∗∗p < 0.001, and ∗∗∗∗p < 0.0001.
