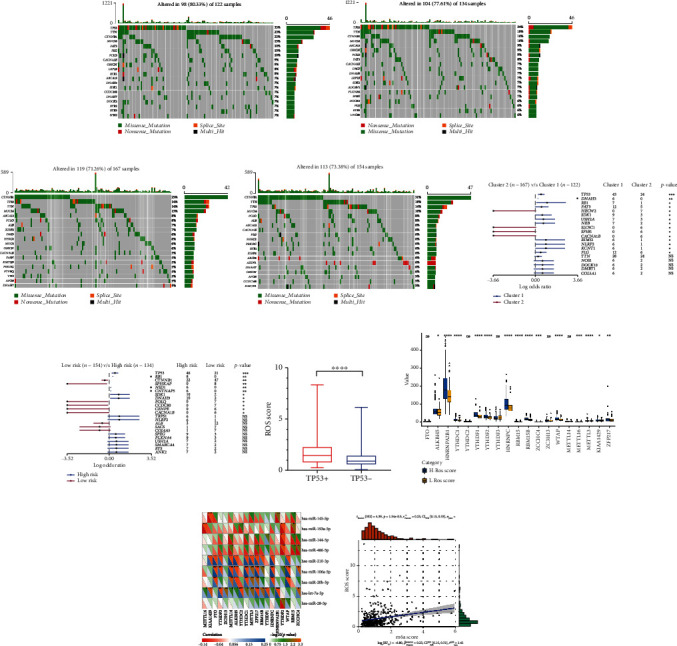
Figure 6.

The correction between gene mutation, m6A methylation, and ROS score. (a) Gene altered of cluster1. (b) Gene altered of the high-risk group. (c) Gene altered of cluster2. (d) Gene altered of the low-risk group. (e, f) Gene mutations in cluster1/2 and high/low-risk groups. (g) The expression of ROS score in HCC patients with TP53+/-. (h) The expression of 19 m6A methylation regulators in high- and low-ROS score patients. (i) The correlation between 19 m6A methylation regulators and 9 ROS-related miRNAs. (j) The correlation between m6Ascore and ROS score. ∗p < 0.05, ∗∗p < 0.01, ∗∗∗p < 0.001, and ∗∗∗∗p < 0.0001.
