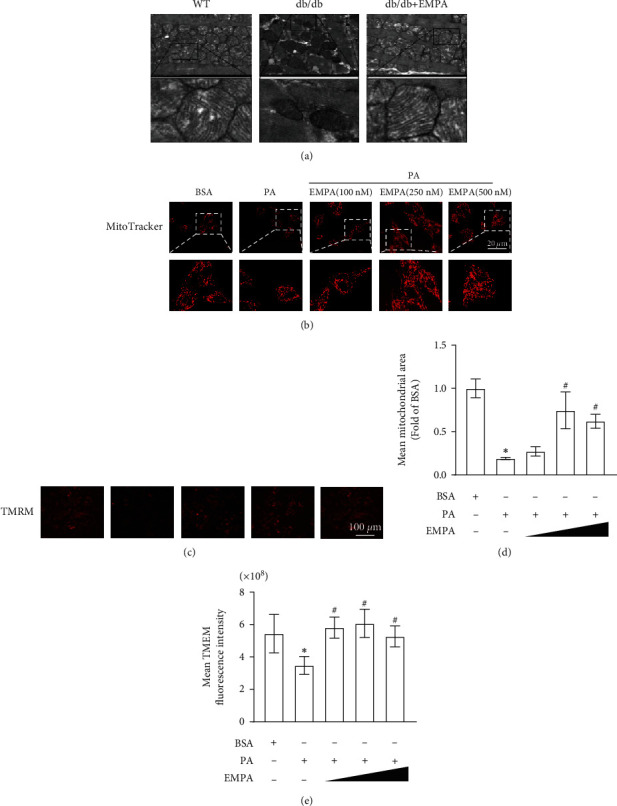
Figure 7.

Effects of EMPA treatment on the mitochondrial morphology and membrane potential of H9C2 cells. (a) Representative TEM images of the heart tissues in WT or db/db mice. (b) Mitochondrial morphology was stained by MitoTracker® Red CMXRos probe and observed under a confocal laser microscope. (c) Representative images of the mitochondrial membrane potential determined by TMRE staining. (d) Calculations of mean mitochondria area. (e) Quantification of fluorescence intensity of TMRE in H9C2 cells under different treatment conditions. Data are shown as mean ± SD, ∗P < 0.05 vs. WT mice group; #P < 0.05 vs. db/db mice treated vehicle group. For heart tissues analysis, n = 5 per group. For H9C2 cells, three independent experiments were conducted.
