Figure 10.

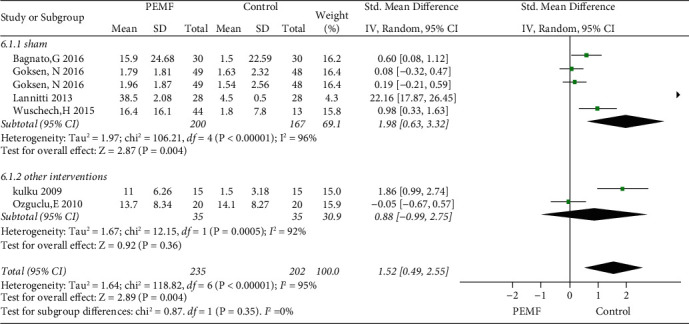
Forest plots represent the effect of PEMF versus control therapies in physical function and subgroup analysis basing on different type of control intervention.

Forest plots represent the effect of PEMF versus control therapies in physical function and subgroup analysis basing on different type of control intervention.