
Figure 10.
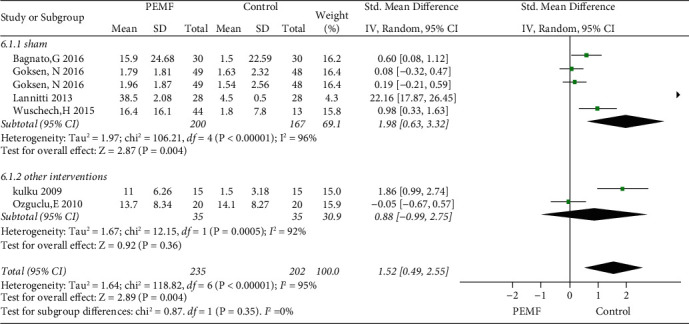
Forest plots represent the effect of PEMF versus control therapies in physical function and subgroup analysis basing on different type of control intervention.
Official websites use .gov
A
.gov website belongs to an official
government organization in the United States.
Secure .gov websites use HTTPS
A lock (
) or https:// means you've safely
connected to the .gov website. Share sensitive
information only on official, secure websites.
Forest plots represent the effect of PEMF versus control therapies in physical function and subgroup analysis basing on different type of control intervention.