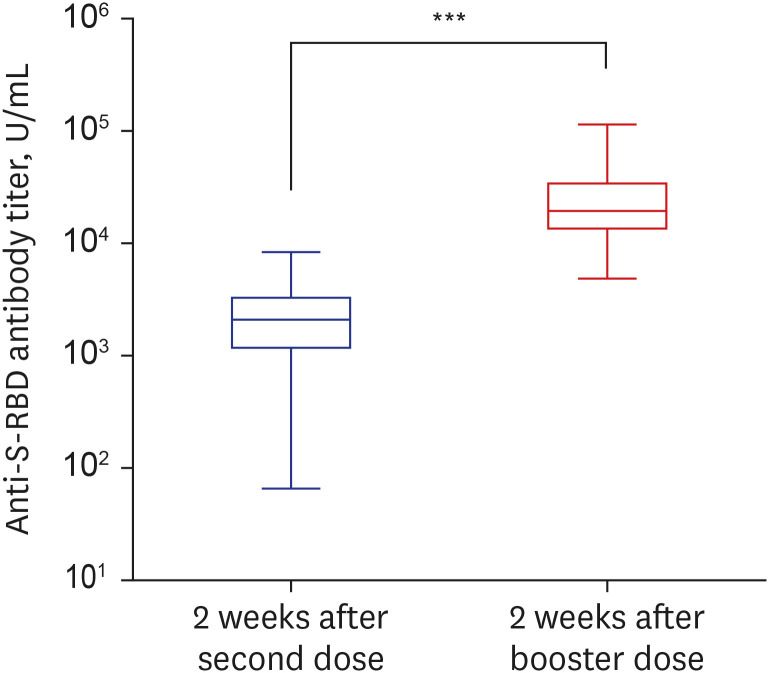
Fig. 1. Comparison of anti-S-RBD antibody titers at 2 weeks after the second dose and 2 weeks after the booster dose of BNT162b2 mRNA vaccination. The box plot graph shows the antibody titer of SARS-CoV-2 by log10 scale. The box bounds the IQR divided by the median, and Tukey-style whiskers extend to a maximum of 1.5 × IQR beyond the box.
S-RBD = spike protein receptor-binding domain, SARS-CoV-2 = severe acute respiratory syndrome coronavirus 2, IQR = interquartile range.
***P < 0.001.

