TABLE III.
Estimates of tissue damage, expressed as percent tissue loss, at 1 mm intervals from APO through P4 in 3 groups of cats (n = 6 each): PPT/PB, subceruleus and LDT/LC lesions
| TOTAL LESION | MOSTLY CHOLINKRGIC CELL REGIONS |
MOSTLY NONCHOLINKRGIC CELL REGIONS |
HISTOLOGIC RECONSTRUCTION |
||||||
|---|---|---|---|---|---|---|---|---|---|
| PPT | PB | LDT | LC complex |
Reticular Core | LEFT PONTINE TEGMENTUM | ||||
| LC | LCa | pLCa | |||||||
| APO | |||||||||
| PPT/PB | 21.8* | --- | --- | 37.5 | --- | --- | --- | --- |
|
| SUBCERULEUS | 0.0 | --- | --- | 0.0 | --- | --- | --- | --- | |
| LDT/LC | 4.5 | --- | --- | 0.0 | --- | --- | --- | --- | |
| P1 | |||||||||
| PPT/PB | 18.1* | 80.0* | --- | 25.8 | 33.8 | --- | --- | 26.6 |
|
| SUBCERULEUS | 2.2 | 6.8 | --- | 19.2 | 8.3 | --- | --- | 23.3 | |
| LDT/LC | 5.1 | 10.0 | --- | 31.7 | 43.3 | --- | --- | 5.8 | |
| P2 | |||||||||
| PPT/PB | 6.7 | 70.8* | --- | 1.0 | 21.1 | 19.1 | 2.3 | 11.6 |
|
| SUBCERULEUS | 4.1 | 19.6 | --- | 20.8 | 29.2 | 57.5* | 53.3* | 42.8* | |
| LDT/LC | 5.0 | 10.0 | --- | 38.3 | 40.0 | 8.3 | 3.3 | 0.3 | |
| P3 | |||||||||
| PPT/PB | 12.0* | --- | 56.3 | 0.0* | 0.0 | 12.5 | 0.0 | 0.0 |
|
| SUBCERULEUS | 5.7 | --- | 9.6 | 31.7 | 33.3 | 50.0* | 66.6* | 40.0* | |
| LDT/LC | 5.2 | --- | 3.3 | 29.2 | 20.0 | 8.3 | 0.0 | 0.3 | |
| P4 | |||||||||
| PPT/PB | --- | --- | {60.0}+ | --- | --- | --- | --- | --- |
|
| SUBCERULEUS | 6.8 | --- | 5.0 | 0.0 | 30.0 | 54.2* | 81.6* | 21.6 | |
| LDT/LC | 5.6 | --- | 21.7 | 12.5 | 30.8 | 4.2 | 0.0 | 0.0 | |
| GRAND MEAN ± SD/LESION GROUPS | Total Lesion | PPT | PB | LDT | LC complex |
Reticular core | |||
| LC | LCa | pLCa | |||||||
| PPT/PB | 14.7*± 7 | 75.4*± 7 | 58.2+ ±3 | 16.1 ±19 | 18.3 ±17 | 15.8 ±5 | 1.2 ±2 | 12.7 ±13 | |
| SUBCERULIUS | 3.7 ±3 | 13.2 ±9 | 7.3 ±3 | 14.3 ±14 | 25.2 ±11 | 54.0* ±4 | 67.2* ±14 | 31.9*±11 | |
| LDT/LC | 5.1± 4 | 10.0 ± 0 | 12.5 ± 13 | 22.3 ± 16 | 33.5 ± 11 | 6.9 ± 2 | 1.1 ± 2 | 1.6 ± 3 | |
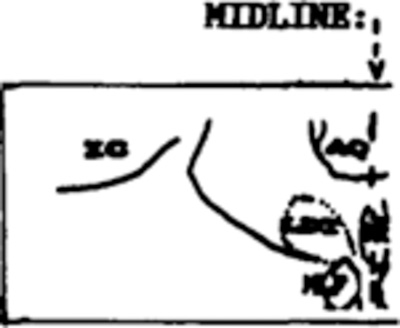
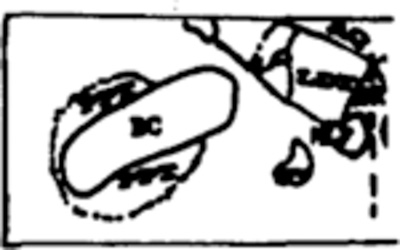
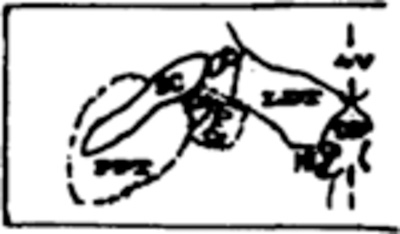
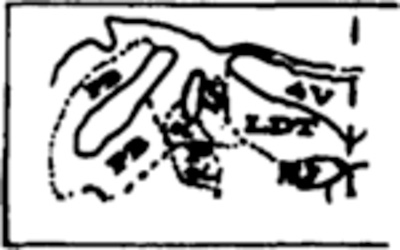
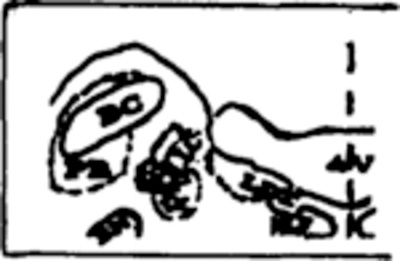
Percentages were derived from the area of lesion, in mm, divided by total mm of tissue. Mean values per group are provided for total lesion size as well as damage to the 3 predominately cholinergic cell regions, including PPT, PB and LDT, and 4 predominately non-cholinergic regions, including locus ceruleus (LC), LC alpha (LCa), peri-LC alpha (pLCa), and the underlying reticular core. A blow-up of a coronal section through the left pontine tegmentum is provided at each AP level to facilitate identification of cholinergic columns and components of locus ceruleus complex on the full coronal sections in Fig. 3. Tissue was available at all planes in all cats except the PPT/PB group, in which tissue was lost posterior to P2 in 4 cats. Since PB exists at P3 and P4, it was not possible to statistically assess total tissue loss at this site (grand mean for PB = 58%+). ANOVAs compared damage estimates per group for each histologic index. Significant group differences were obtained for total lesion size (F = 5.9, P < 0.05), PPT damage (F = 58.04, P < 0.001), LC alpha (F = 29.94, P < 0.001), peri-LC alpha (F = 20.11, P < 0.001) and the underlying reticular formation (F = 10.27, P < 0.001).
Post-hoc t-tests were statistically significant at P < 0.05 from other groups; { } includes tissue from only 1 cat; - - - structure not present at that AP, or insufficient tissue available (PPT/PB group at P4 only).
