
Figure 5: OT-82 potentiates currently used therapies for pediatric high-risk ALL.
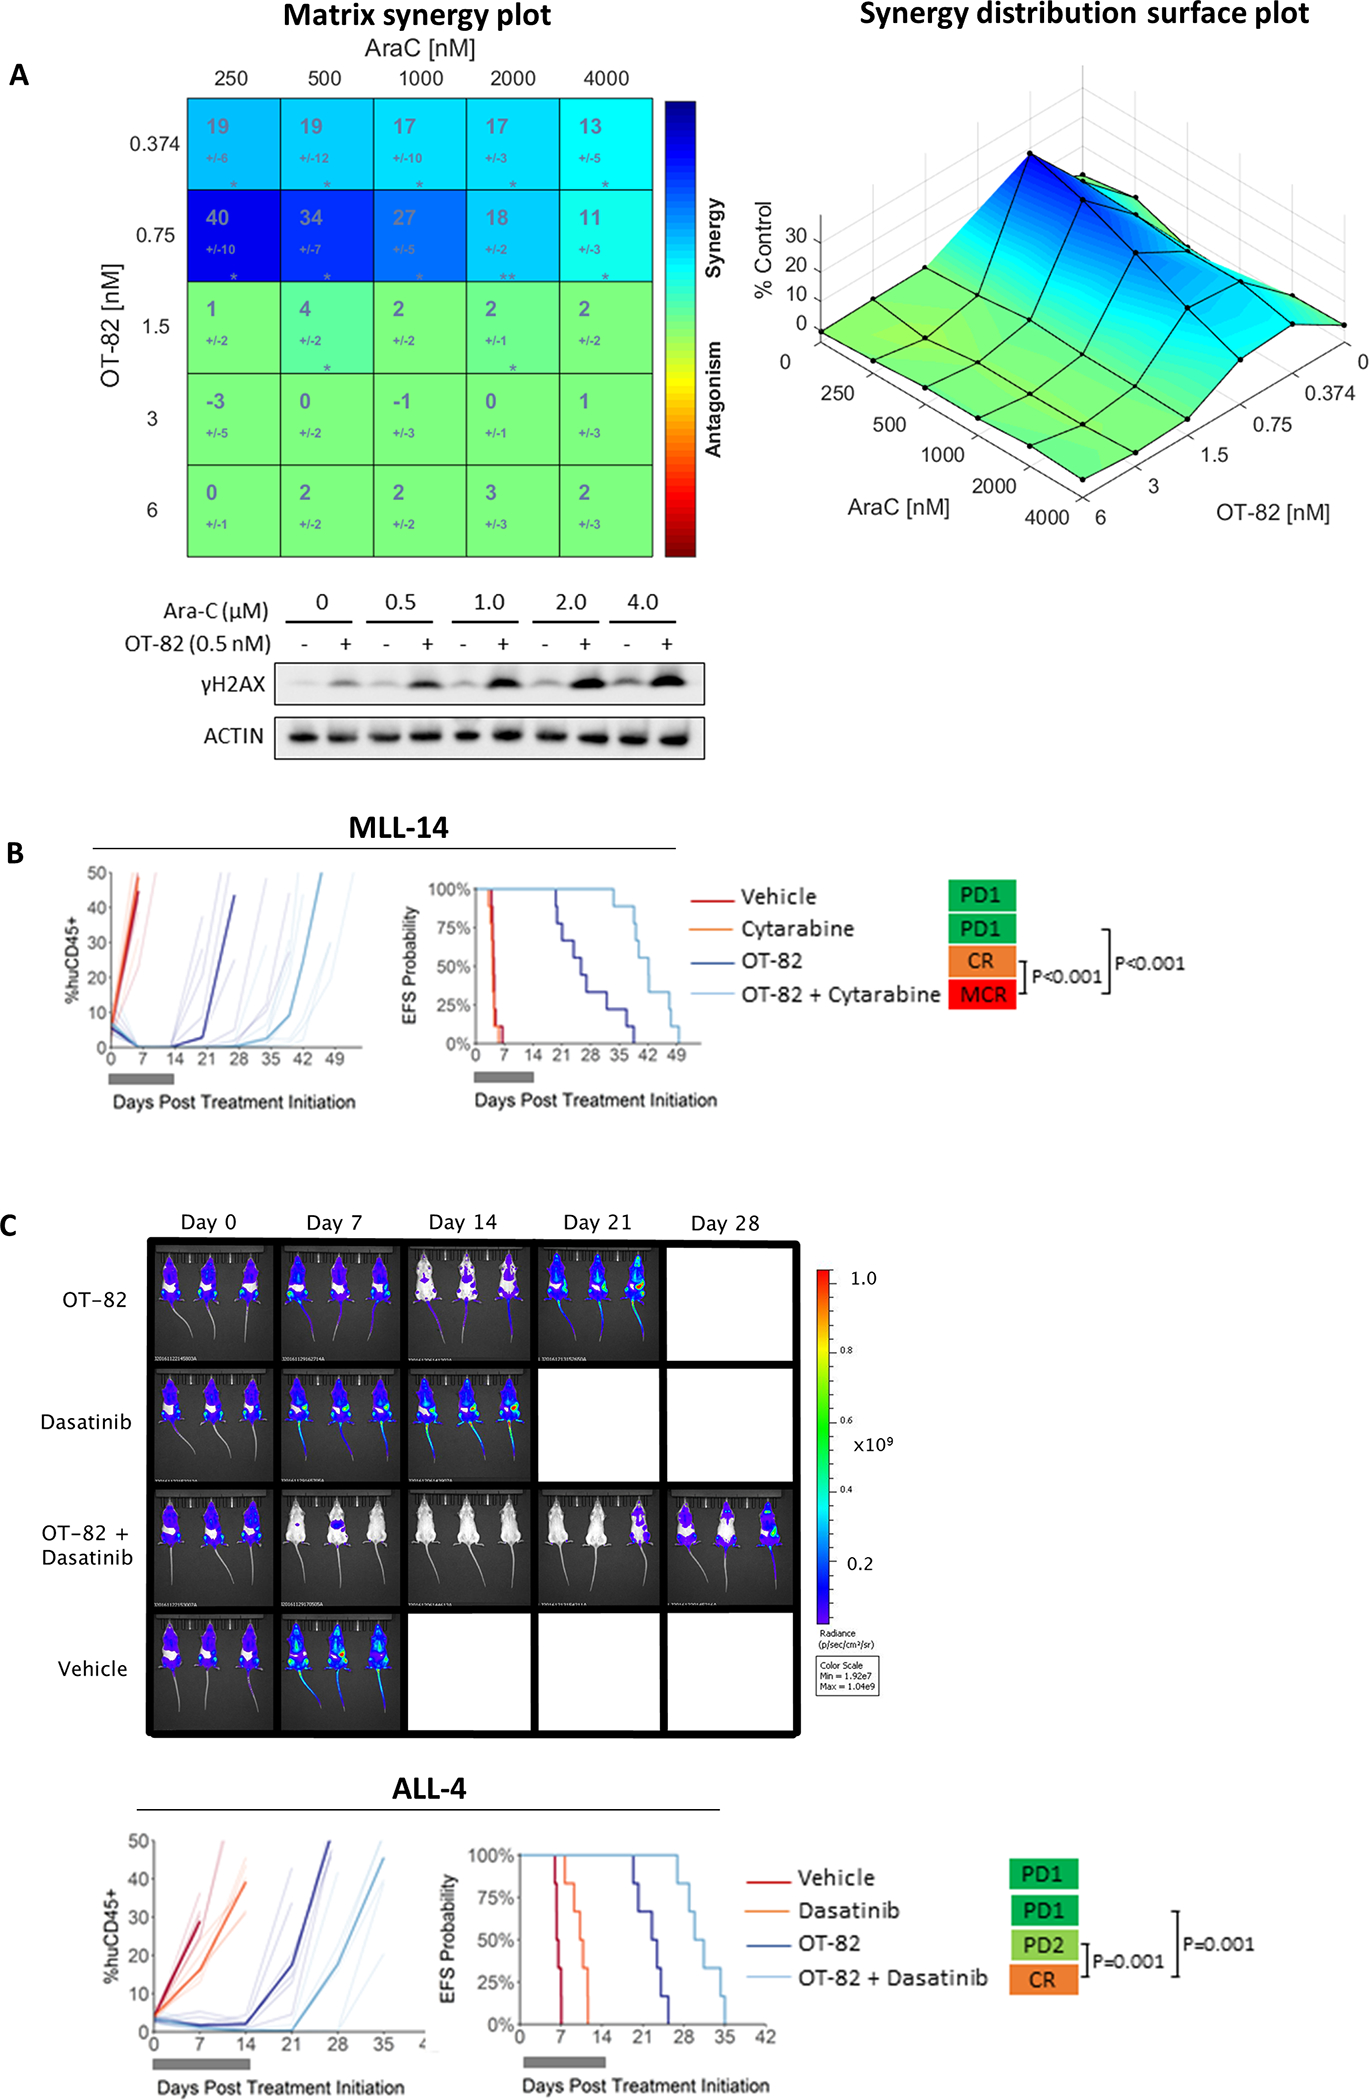
(A) PER-485 cells were treated with increasing doses of OT-82 combined with AraC in a 6×6 matrix format, at a fixed ratio with 2-fold incremental increases in drug concentrations. Cell viability was measured by resazurin reduction assays at 72 h and synergy was scored by Bliss and visualized by Combenefit. The matrix synergy plot (left panel) displays the synergy score for each combination +/− standard deviation as well as statistical significance of synergy for each combination (*, P<0.05; **, P<0.01) in 4 independent experiments. The right plot displays the synergy distribution according to Bliss. Representative immunoblotting on lysates from the PER-485 cell line treated with a sublethal dose of OT-82 or vehicle and a dose range of Ara-C for 48h (2 independent experiments except for 0.5 μM AraC: n=1). (B) Response of MLL-14 PDX treated with OT-82 (dark blue lines, 40 mg/kg p.o., 3 days on/4 days off, 2 weeks), Cytarabine (orange lines, 25 mg/kg i.p., 5 days/week, 2 weeks), OT-82+Cytarabine (light blue lines, same protocol as single agents) or vehicle control (red lines). (C) Response of ALL-4 PDX treated with OT-82 (dark blue lines) (40 mg/kg p.o., 3 days on/4 days off, 2 weeks), dasatinib (orange lines, 15 mg/kg, 5 days/week, 2 weeks), OT-82+dasatinib (light blue lines) or vehicle control (red lines). In (B-C) the left panels represent the % huCD45+ cells of individual mice over time (thin lines represent individual mice; bold lines represent group median). The right panels show the proportion of mice that remain event-free in a Kaplan-Meier plot. Gray bars represent the treatment period. Bioluminescent images of three randomly selected mice for each cohort are shown at weekly intervals. Images from the three additional mice are shown in Supplementary Figure 7C. MCR, Maintained Complete Response; CR, Complete Response; PR, Partial Response; PD1, Progressive Disease 1.