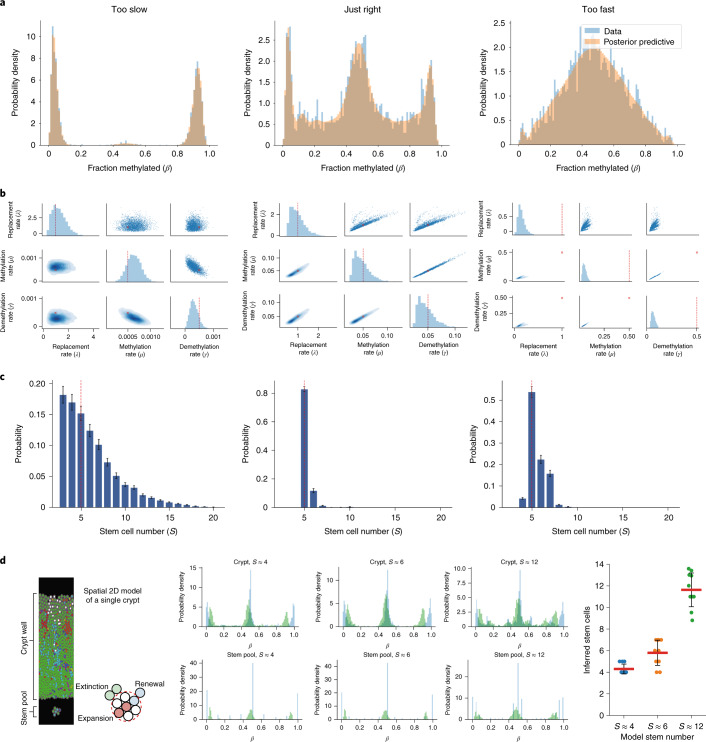
Fig. 3. W-shaped methylation distributions are indicative of clonal dynamics.
In silico evaluation of the accuracy of Bayesian inference on stem cell number (S), replacement rate (λ) and (de)methylation rates (μ,γ) as a function of input (de)methylation rates. Three regimens were evaluated: μ = γ = 0.0005 methylation events per allele per stem cell per year (‘too slow’), very high methylation rates (μ = γ = 0.5 per allele per stem cell per year (‘too fast’)) and intermediate methylation rates (μ = γ= 0.05 per allele per stem cell per year (‘just right’)). a, Simulated fCpG methylation distributions from individual crypts at each of three input (de)methylation rates. The characteristic W distribution is only evident for the just-right (de)methylation rate. b, Posterior distributions of inferred replacement and (de)methylation rates for each input (de)methylation rate. c, Posterior distributions of inferred stem cell number. The stem cell number posterior mean was calculated by taking the softmax of the log evidence, while the error bars were calculated from the estimated error (1 s.d.) on the log evidence. In b and c, red dashed lines indicate the true (inputted) value of the parameter. The simulated datasets each contained S = 5 stem cells, had a replacement rate of λ = 1.0 per stem cell per year, and the noise due to sampling was simulated with offsets due to background noise and peak specific noise with sample size kz = 100. d, Independent validation of the inference method on a spatial representation of the single crypt with varying stem cells. Methylation distributions are noise adjusted (Methods) for the inferences on the stem pool only. Mean inferred stem cell numbers are shown for ten replicate simulations, and the red bar represents the mean of the ten replicates while the error bars denote 1 s.d.

