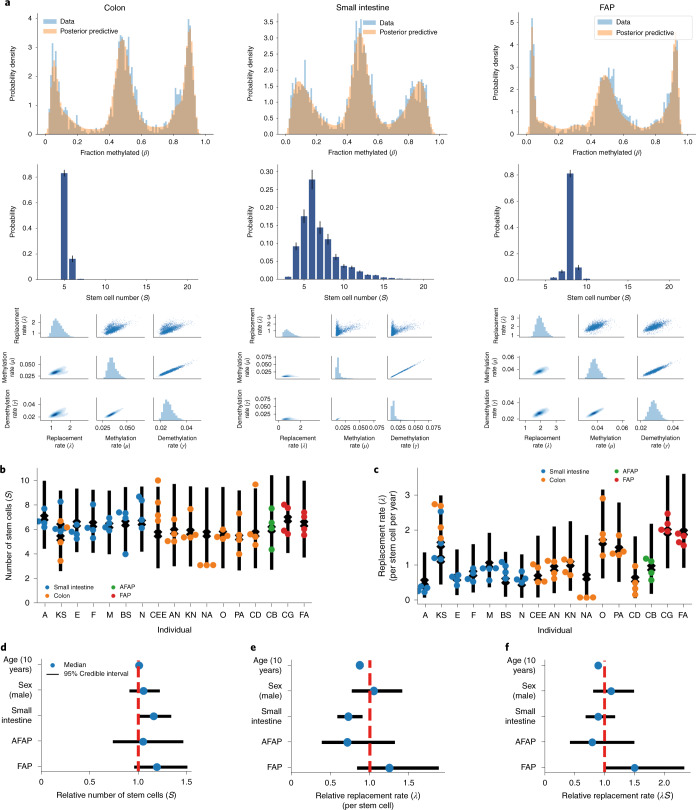
Fig. 4. Tissue-specific differences in stem cell dynamics.
The stem cell dynamics Bayesian inference framework was applied to 71 individual intestinal crypts originating from 17 individuals. a, Examples of the posterior predictive distributions, the discrete stem cell number posterior and the posterior for the replacement rate, methylation rate and demethylation rate in crypts derived from normal colon, small intestine and the colon of individuals with FAP (left to right). Error bars were calculated from the estimated error (1 s.d.) on the log evidence. b, Individual crypt and posterior mean per individual for the stem cell number; AFAP, attenuated familial adenomatous polyposis. c, Replacement rate per stem cell with the 95% credible range of the GLM expectation, accounting for age, sex, tissue, disease state and intra- and interindividual heterogeneity. d–f, Posterior distributions for the effect of age (per decade), sex (with female encoded as reference), tissue type and disease state on the relative number of stem cells (d), replacement rate per stem cell (e) and total number of replacements (f) compared to normal colon. A Bayesian parameter estimation hypothesis testing approach was taken, such that a difference was called significant if the 95% credible region did not overlap.

