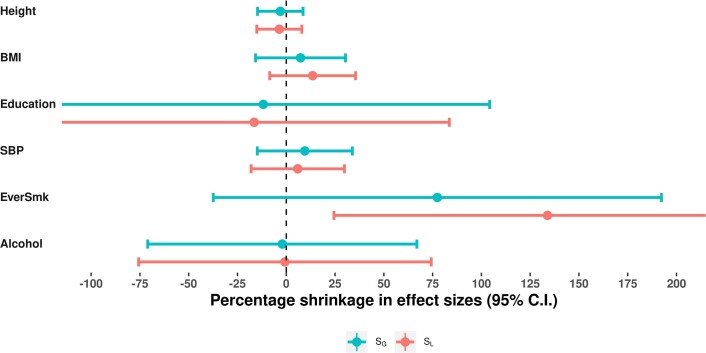
Extended Data Fig. 3. Within-sibship shrinkage estimates from China Kadoorie Biobank.
SG = score including variants with P < 5×10⁻⁸, SL = score including variants with P < 1×10⁻⁵, BMI = body mass index, SBP = systolic blood pressure, EverSmk = ever smoking. Extended Data Figure 3 contains within-sibship shrinkage estimates and 95% confidence intervals for height, BMI, educational attainment, systolic blood pressure and ever-smoking genetic variants in China Kadoorie Biobank. Shrinkage is defined as the % decrease in association between the relevant weighted score and phenotype when comparing the population estimate to the within-sibship estimate. Shrinkage was computed as the ratio of two weighted score association estimates with standard errors derived using leave-one-out jackknifing. The figure includes genetic variants from the genome-wide significant (blue) and liberal (red) thresholds. Note that the genetic variants tested were identified in UK Biobank, but any ancestral differences will likely equally affect both the population and within-sibship estimates, meaning that the shrinkage estimate are unlikely to be biased by ancestral differences. Data was available from n = 13,856 individuals for each of the 6 phenotypes.

