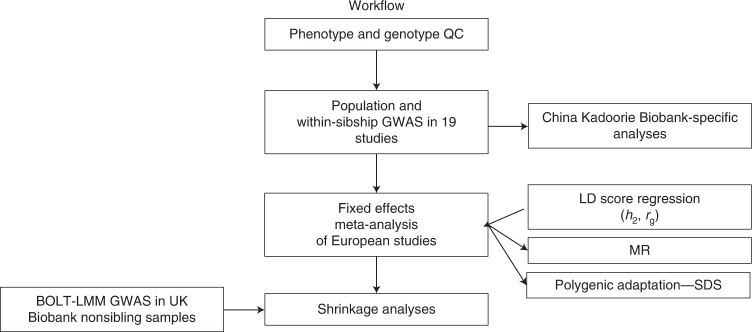
Fig. 3. A flowchart of analyses undertaken in this project.
We started by performing quality control and running GWAS models in 19 individual cohorts. We then meta-analyzed GWAS data from 18 of these cohorts with European-ancestry individuals. We then used the European meta-analysis data for downstream analyses including LDSC, MR and polygenic adaptation testing. We performed analyses in the China Kadoorie Biobank separately. QC, quality control.

