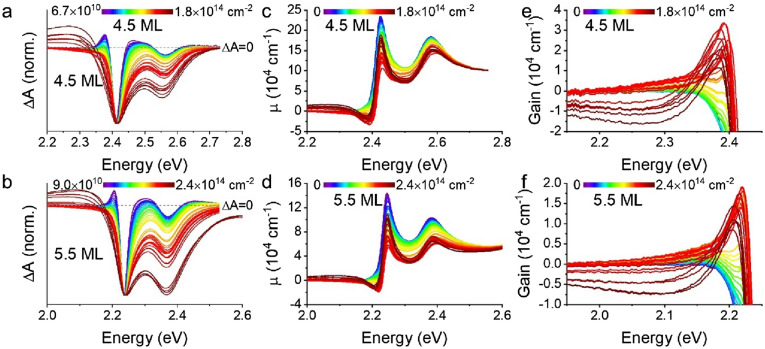
Figure 2.
(a,b) Normalized transient absorption spectra (ΔA) of representative (a) 4.5 and (b) 5.5 ML CQW samples as a function of photogenerated sheet density. Each spectrum is collected at a 3 ps pump-probe delay for many powers of 3.5 eV pump light. (c,d) Linear absorption (cm−1) calculated for many photogenerated sheet densities of the same (c) 4.5 and (d) 5.5 ML samples. (e,f) Zoomed in regions of (c) and (d), respectively, showing the spectral window of gain.

