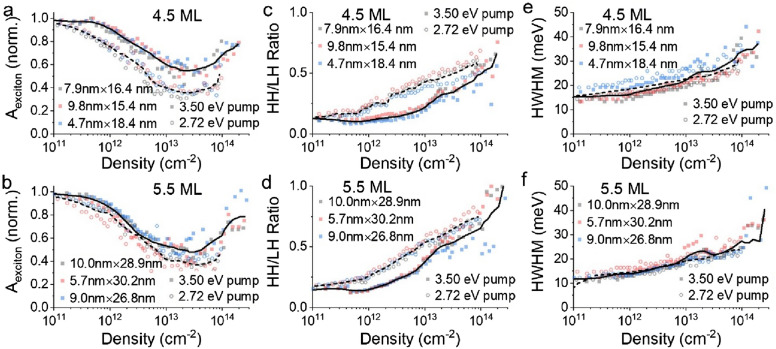
Figure 3.
(a,b) Normalized exciton absorption intensity for three (a) 4.5 and (b) 5.5 ML CQW samples as a function of photogenerated sheet density. Each data point is extracted from a transient absorption spectrum collected at 3 ps pump-probe delay for many powers of 2.72 eV and 3.50 eV pump light. (c,d) Ratio of heavy hole and light hole bleach signals as a function of photogenerated sheet densities for the same (c) 4.5 and (d) 5.5 ML samples. (e,f) Half-width at half-maximum (HWHM) of the HH bleach feature from the transient absorption spectrum (ΔA) plotted against photogenerated sheet densities of the same (e) 4.5 and (f) 5.5 ML samples. In all cases, data for measurements with 3.50 eV pump are shown in solid symbols and data for 2.72 eV pump measurements are shown in open symbols. A solid line represents a smoothed average of 3.50 eV pump experiments and a dashed line corresponds to the smoothed average of 2.72 eV pump.

