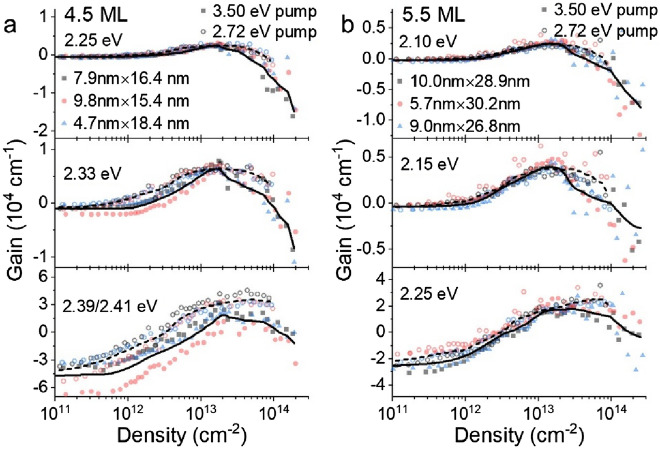
Figure 4.
(a,b) Line-cuts of gain or loss at 3 ps pump-probe delay for representative energy values as a function of photogenerated sheet density for (a) 4.5 ML and (b) 5.5 ML CQW samples. In all cases, data for measurements with 3.50 eV pump are shown in solid symbols and data for 2.72 eV measurements are shown in open symbols. A solid line represents a smoothed average of 3.50 eV pump experiments and a dashed line corresponds to the smoothed average of 2.72 eV pump.

