Figure 6.
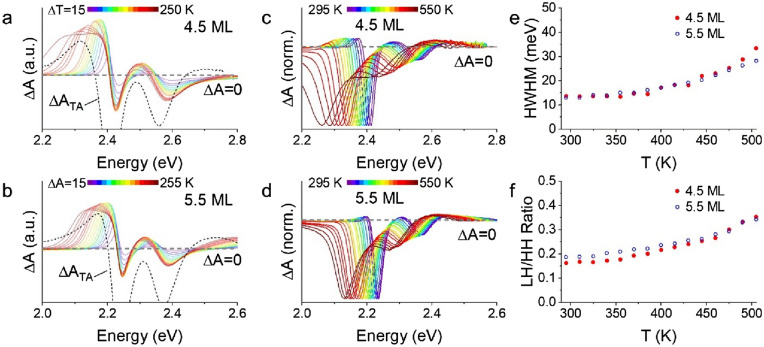
(a,b) Thermal differential absorption spectra (ΔA = AT-A295 K) of (a) 9.8 nm × 15.4 nm 4.5 ML and (b) 9.0 nm × 26.8 nm 5.5 ML CdSe CQWs are shown in colors. The black dashed line shows the ΔA of the same 4.5 or 5.5 ML CdSe CQWs under intense photoexcitation (> 5 × 1013 cm−2). The plots are scaled for presentation. (c,d) Transient absorption spectra collected at a pump-probe delay of 3 ps and average excitation density < 1 × 1012 cm−2 as a function of sample temperature. (e) Half-width at half-maximum of transient absorption bleach features as a function of temperature based upon data in figure panels (c) and (d). (f) Ratio of the light hole (LH) and heavy-hole (HH) bleach feature as a function of sample temperature using data in (c) and (d).

