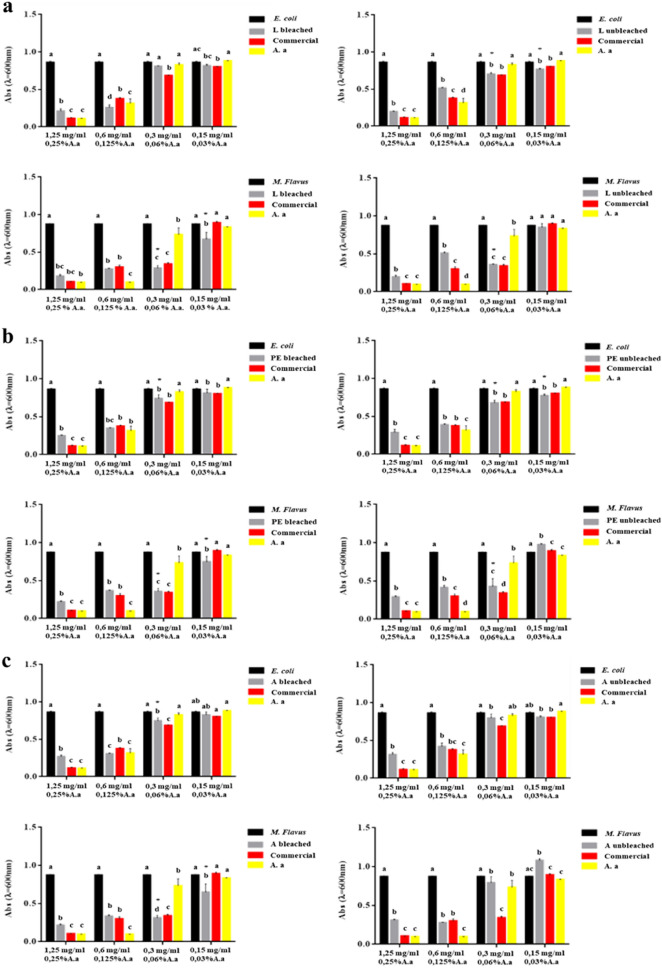
Figure 4.
Results of microdilution assay for bleached and unbleached chitosan from larvae (a), pupal exuviae (b) and dead adults (c) of H. illucens, commercial chitosan and acetic acid at the four concentrations of 1.25, 0.6, 0.3, 0.15 mg/ml against E. coli and M. flavus. Bars indicate the absorbance of the bacterial culture (black bars) and that of the culture treated with H. illucens chitosan samples (gray bars), commercial chitosan (red bars) and acetic acid (yellow bars). Data are presented as mean ± standard error of three independent experimental biological replicates. Different letters indicate significant differences (p < 0.05) between absorbance values of the bacterial culture alone and that of bacteria treated with the different concentrations of each treatment. Asterisks indicate significant differences (p < 0.05) among treatments for the same concentration. Data are analyzed with two-way ANOVA and Bonferroni post-hoc test.

