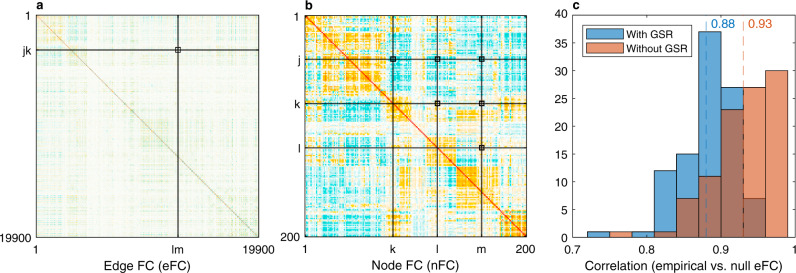
Fig. 1. The edge functional connectivity (eFC) can be derived analytically from the node functional connectivity (nFC) under the static Gaussian null model.
a The eFC of the first subject from the Human Connectome Project (HCP) fMRI dataset is plotted as an example. This matrix scales with the fourth power of the parcellation size: in the current case of 200 parcels, it has ~400 million elements. The (jk, lm) entry of the eFC matrix (black square at the intersection of the black lines) is computed as the inner product of two edge time series jk and lm, normalised to the [−1, 1] interval. b Under the static null model, the eFC of each subject can be derived analytically as a sum of pairwise products between the (j, k, l, m) entries of the corresponding nFC matrix as per Eq. (1). Since the nFC is symmetric, only six entries are necessary to represent all pairwise combinations (marked by each of the black squares at the intersections of the black lines). c Distribution of Pearson correlation coefficients between the empirical and null eFC computed over 100 HCP subjects. Results are reported with and without global signal regression (GSR) and the mean correlation values are indicated by the dashed lines.

