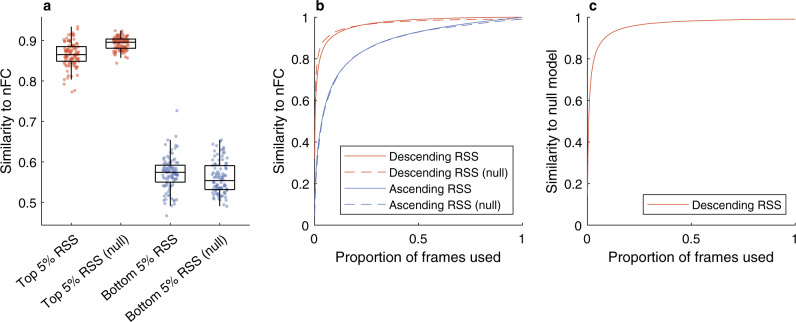
Fig. 3. The static Gaussian null model can reproduce the strong correlation between high-amplitude cofluctuation patterns and the nFC.
a Only a small fraction of frames exhibiting the largest cofluctuations root-sum-of-squares (RSS) are required to explain most of the nFC variance. The similarity is computed as the Pearson correlation coefficient between the nFC and the average FC estimated from the top and bottom 5% of the total frames. Each point corresponds to one of 100 unrelated subjects from the Human Connectome Project (HCP) dataset, with boxes indicating the quartiles and whiskers length specified as 1.5 times the interquartile range. b The same results hold more generally when the frames are ordered according to the corresponding RSS amplitude, either in descending or ascending order. Here, the curves represent the average similarity over 100 subjects. c The findings do not depend on the timing of the high-amplitude RSS events: the top frames generated by the null model exhibit high similarity to the top frames of the real HCP data, which occur at different times.

