Figure 2.
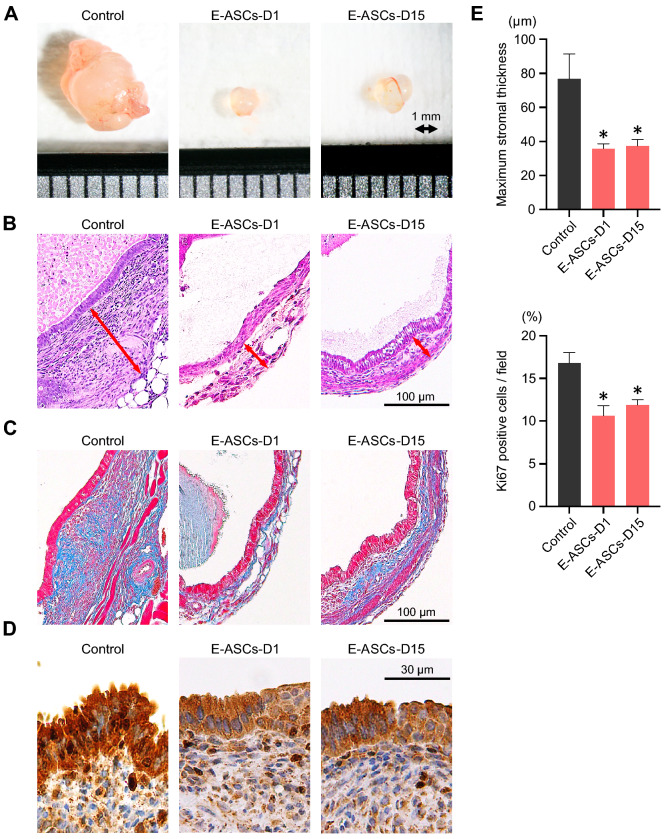
Macroscopic alterations and histopathology of endometriosis-like lesions after treatment with ASCs. (A) Representative excised implants from the endometriosis-like lesions. The interval at the bottom represents 1 mm. (B–D) Representative images of pathological specimens from excised implants stained with hematoxylin and eosin (B), Masson’s trichrome (C), and Ki67 (D). The red arrow in (B) indicates the maximum stromal thickness from the bottom of the endometrium to the surface of each cyst. The blue and red stains in (C) indicate collagen fibers and cells (mainly: fibroblasts) in the endometriosis-like lesions. (E) Quantification of maximum stromal thickness from the bottom of the endometrium to the surface of each cyst (top) and the percentage of Ki67-positive cells stained in the endometriotic epithelial cells (bottom). Data are presented as the mean ± standard error. *P < 0.01 vs. Control.

