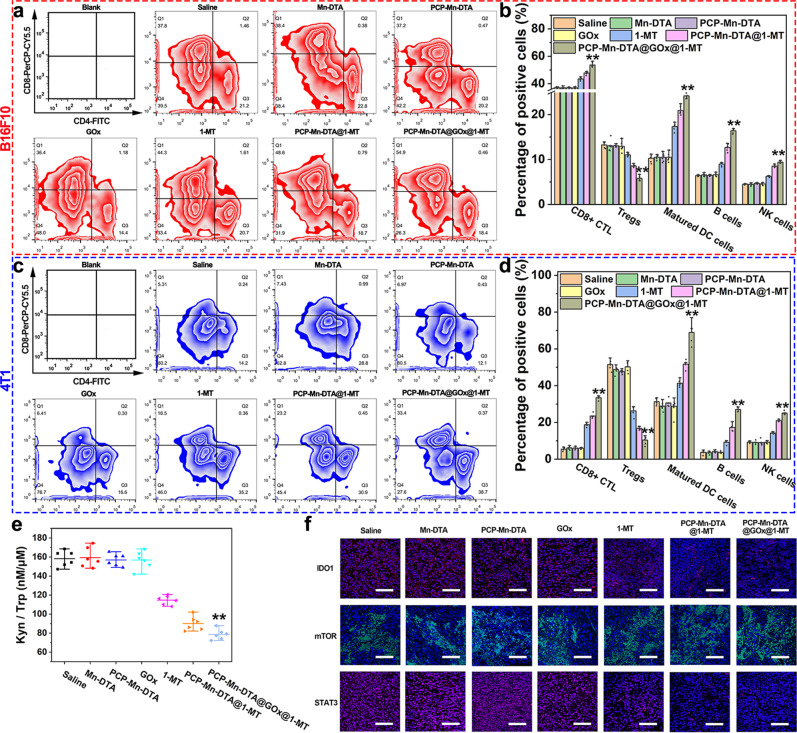
Fig. 8. In vivo activation of immune response and suppression of immune resistance by PCP-Mn-DTA@GOx@1-MT nanosystem.
a, c FCM and (b, d) quantitative analysis on the populations of tumor-infiltrating CD8+ T cytotoxic cells, Treg cells, NK cells, dendritic cells, and B cells from the B16F10 tumor-bearing C57BL/6 mice and 4T1 tumor-bearing Balb/c mice after 4 days post-administration, respectively. e Kyn/Trp ratio changes of B16F10 tumor model after above treatment for 4 days. f IFC images of tumor sections stained with anti-IDO, anti-mTOR, and anti-STAT3, with images representative of 3 experiments. Scale bar: 100 µm. Data represent mean ± SD (n = 6 biologically independent samples). P-values were determined by unpaired Student’s t-test (two-tailed), **p < 0.01.

