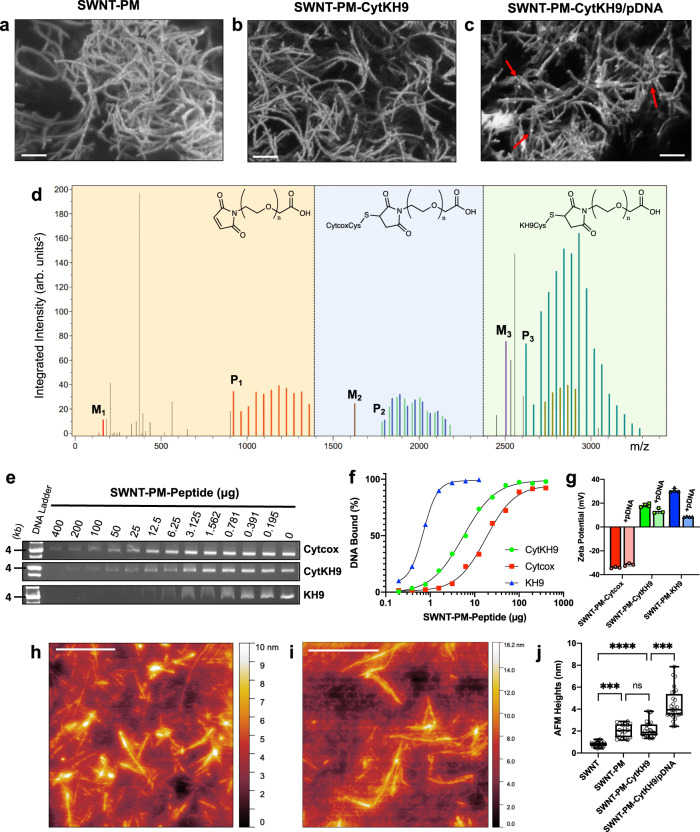
Fig. 2. Physical and chemical characterization of SWNT NCs and their DNA binding characteristics.
FE-SEM micrographs of (a) SWNT-PM, (b) SWNT-PM-CytKH9, and (c) SWNT-PM-CytKH9/pDNA show typical SWNT morphology after excess peptide has been removed by dialysis. Scale bars represent 200 nm. White arrows indicate complexed pDNA on the surface of the SWNT. Representative micrographs are shown from 4 imaged drops for each condition (n = 4). d Polymer analysis using the MALDI-TOF/MS data of the peptide fragments cleaved from SWNT-PM-CytKH9 upon alkaline hydrolysis shows the size distribution of the incorporated PEG for unfunctionalized polymer (orange), Cytcox-functionalized polymer (blue), and KH9-functionalized polymer (green). The single maleimide methacrylate monomer unit and unconjugated Cytcox and KH9 peptides are labeled M1, M2, and M3, respectively, and the lowest identifiable peaks for the conjugated species are labeled P1, P2, and P3 and represent a single methacrylate monomer unit conjugated to the respective peptides. Pairs of peaks in regions 2 and 3 correspond to the oxidized ions (m/z + 16). e Representative gel shift electrophoresis mobility assay showing the amount of residual uncomplexed DNA at different SWNT-PM-Peptide/pDNA ratios. f Quantification of the respective band intensities from (e) to estimate DNA bound for each SWNT-PM-Peptide. g Zeta potentials of SWNT-PM-Peptide with different functional peptides in the absence and presence of pDNA. Data are represented as the mean ± standard deviation values (n = 3). h, i AFM micrographs of SWNT-PM-CytKH9 in the (h) absence and (i) presence of pDNA on a graphite surface. Scale bars represent 500 nm. Representative AFM images are shown from three measured samples for each sample condition (n = 3). j Quantified AFM heights of pristine SWNT and SWNT NCs. Cross-sectional topography measurements (n = 25) were taken to estimate the respective heights across a minimum of three AFM samples for each condition. Data points are individually shown with the respective box and whisker plots depicting the maxima, minima, median and the first (25%) and third (75%) quartiles; Significance between individual samples was determined by one-way ANOVA. P-values are 0.0002 for comparisons between SWNT and SWNT-PM, 0.0002 between SWNT-PM-CytKH9 and SWNT-PM-CytKH9/pDNA, and <0.0001 between SWNT and SWNT-PM-CytKH9. ns – not statistically significant, ***P < 0.001, ****P < 0.0001. Source data are provided as a Source Data file.

