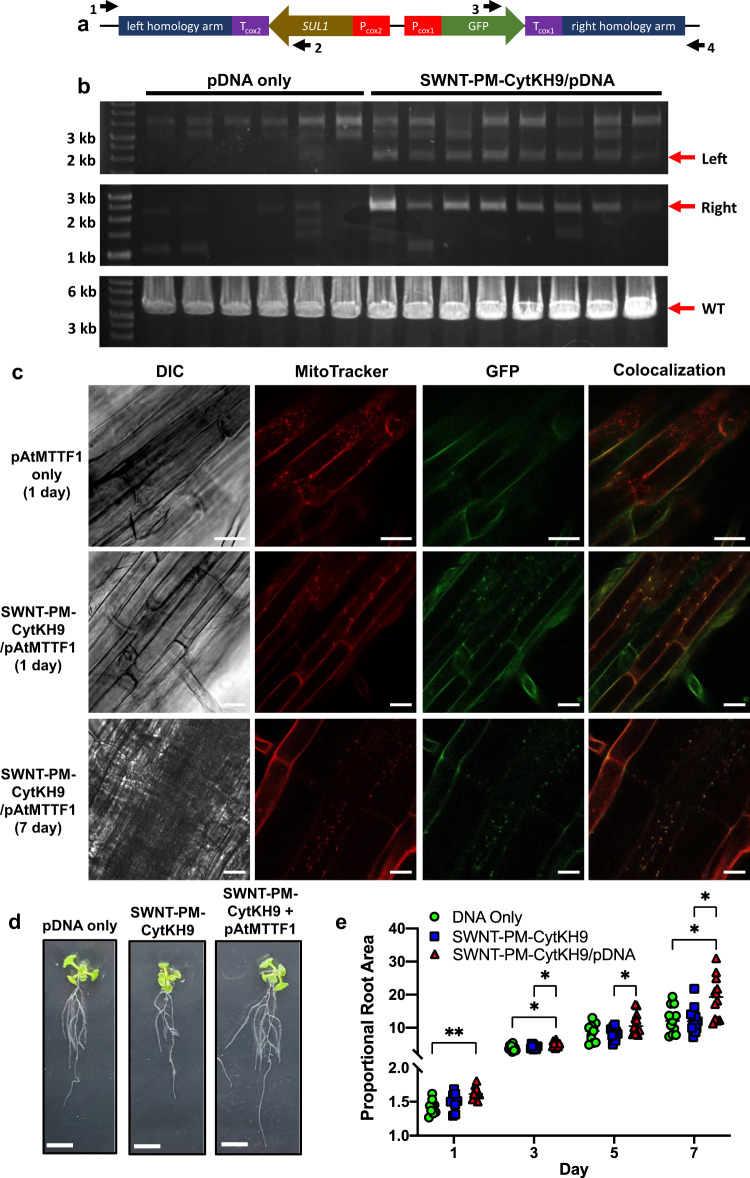
Fig. 6. Genotyping and phenotypic effects in A. thaliana upon infiltration with SWNT-PM-CytKH9/pAtMTTF1 pDNA complexes.
a Design of a plasmid DNA construct (pAtMTTF1) for integration into the mitochondrial genome of A. thaliana. SUL1 encodes dihydropteroate synthase type-2, which was previously used as a selection marker for mitochondrial transformation36. b PCR analysis of the exogenous DNA inserted into the mitochondrial genome 7 days after infiltration by primer pairs targeting the left or right junctions between the inserted DNA and the mitochondrial genome. The arrows indicate the size of the expected PCR products. Amplification of the wild-type locus is shown in the bottom panel. Raw sequencing data are provided in Supplementary Data 1 and 2. 6 and 8 representative samples are shown from a minimum of 30 biological replicates (n = 30) for pDNA only and SWNT-PM-CytKH9/pDNA treated samples, respectively. c Representative confocal laser scanning microscopy images of A. thaliana root cells (from a minimum of five seedlings for each condition n = 5) infiltrated with pDNA containing the pAtMTTF1 reporter construct for mitochondrial genome integration. Mitochondria were stained with MitoTracker Red (CMXRos), and colocalization analysis was performed on GFP and MitoTracker signals 1 and 7 days post transformation. Scale bars represent 20 μm. d Representative images of seedlings upon infiltration with SWNT-PM-CytKH9/pAtMTTF1 that showed SUL1-mediated growth improvement after 3 days. Scale bars represent 1 cm. Other days can be found in Supplementary Figs. 16–19. e Quantification of root areas of A. thaliana seedlings at 1, 3, and 7 days after transformation with SWNT-PM-CytKH9/pAtMTTF1 complexes relative to the initial area. Each data point represents one biological seedling replicate and their respective means for each treatment condition. Statistical significance was determined by two-way ANOVA (Tukey’s multiple comparisons) with matched measurements for each replicate. For Day 1 samples, P-values are 0.001 between DNA only and SWNT-PM-CytKH9/pDNA. For Day 3 samples, P-values are 0.0312 between DNA only and SWNT-PM-CytKH9/pDNA and 0.0258 between SWNT-PM-CytKH9 and SWNT-PM-CytKH9/pDNA. For Day 5 samples, P-values are 0.024 between SWNT-PM-CytKH9 and SWNT-PM-CytKH9/pDNA. For Day 7 samples, P-values are 0.0190 between DNA only and SWNT-PM-CytKH9/pDNA and 0.0168 between SWNT-PM-CytKH9 and SWNT-PM-CytKH9/pDNA. *P < 0.05, **P < 0.01. Source data are provided as a Source Data file.

