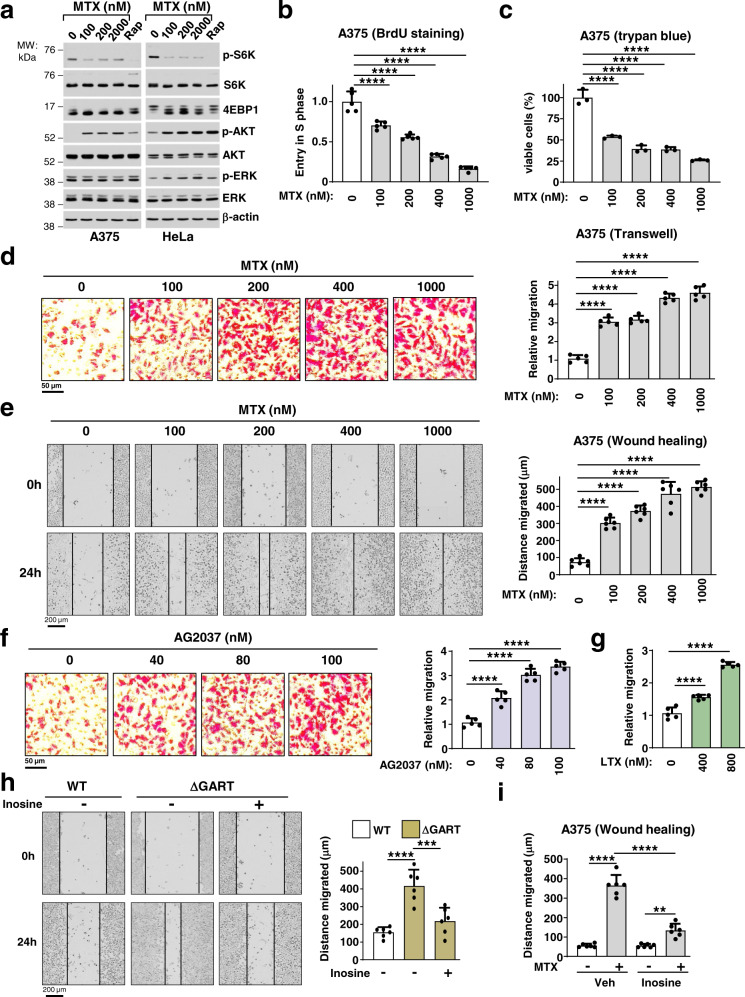
Fig. 1. Purine depletion triggers cell migration despite a decrease in cell viability.
a Immunoblots of A375 and HeLa cells treated for 24 h with the indicated doses of MTX. b, c Cell-cycle progression through S phase (cell proliferation, BrdU incorporation) (b) and relative cell viability (Trypan blue) (c) of A375 cells treated with either vehicle (DMSO) or the indicated doses of MTX for 24 h. d Representative images of A375 cells after migration through a transwell (Boyden chamber) treated with either vehicle or the indicated doses of MTX. The migrated cells from five independent biological replicates are presented as relative migration normalized to control (untreated). e Representative images of A375 cells after a wound-healing assay, which were treated with the indicated doses of MTX for 24 h in A375 cells. Quantification of the migrated distance [Gap distance at time 0 h minus gap distance at 24 h] from 6 independent biological replicates. f Representative images of A375 cells after migration through a transwell treated with either vehicle or the indicated doses of GART inhibitor AG2037. The migrated cells were counted from five independent biological replicates and presented as relative migration normalized to control (untreated). g Quantification of the relative migration from a transwell assay in A375 cells treated with vehicle (DMSO) or with the indicated doses of LTX for 24 h as in (f). h Representative images from a wound-healing assay of wild-type and ΔGART HeLa cells grown with or without inosine (50 µM) for 24 h. Quantification of the migrated distance was done as in e. i Quantification of the migrated distance from a wound-healing assay (24 h) as in e, in A375 cells treated for 24 h with MTX in the presence or absence of inosine (50 µM). b–i Data are presented as the mean ± s.d from n = 3 (c), or n = 5 (b, d, f, g) or n = 6 (e, h, i) of biologically independent samples. b–i One-way ANOVA, Turkey’s post-hoc test, multiple comparison, **p < 0.01, ***p < 0.001, ****p < 0.0001. d–f, h Scale bars are indicated. a–i Data are representative of n = 2 (a), n = 3 (b–i) independent experiments. Source data and exact p-values are provided as a Source Data file.

