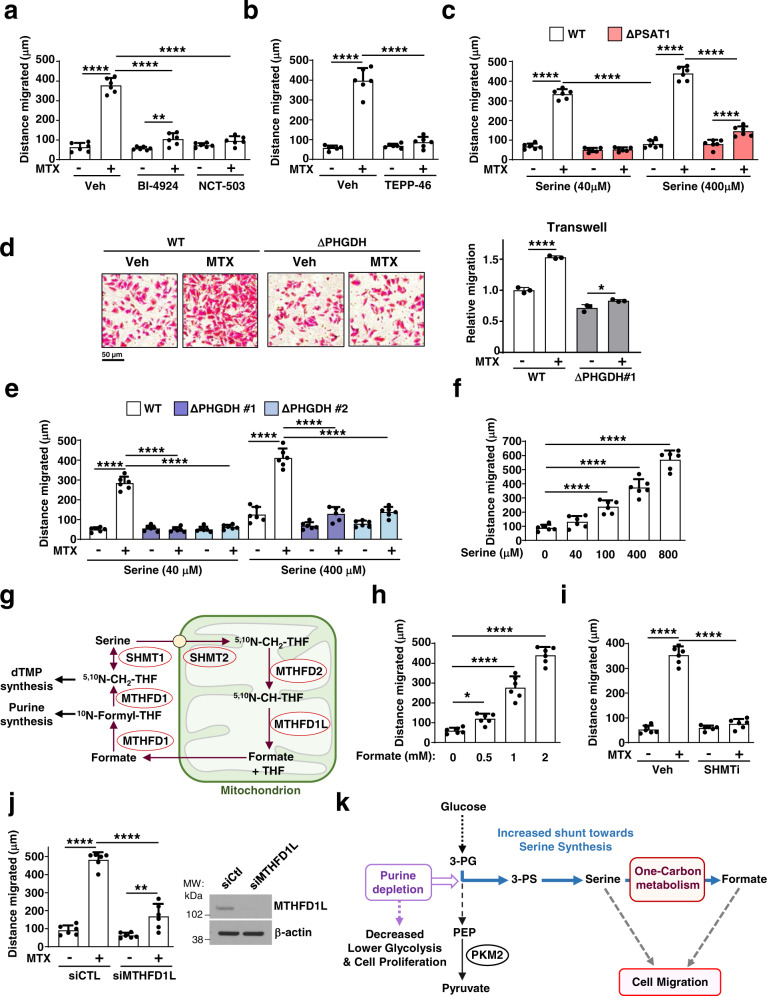
Fig. 4. Purine depletion-induced cell migration is dependent on serine synthesis and one-carbon metabolism.
a Quantification of the migrated distance (Wound-healing assay, 24 h) of A375 cells after MTX treatment (100 nM) in the presence or absence of PHGDH inhibitors (BI-4924, 15 µM and NCT-503, 10 µM). b As in (a), but from A375 cells after MTX treatment (100 nM) in the presence or absence of TEPP-46 (100 µM). c As in a, but from wild-type or PSAT1 knockout (ΔPSAT1) HeLa cells after MTX treatment (100 nM) in growth media with 40 µM or 400 µM of serine. d Representative images and quantification of wild-type or ΔPHGDH A375 cells (transwell assay) treated with either veh or MTX (200 nM) cultured in 40 µM of serine. Relative migration normalized to control (untreated). e Quantification of the migrated distance (Wound-healing assay, 24 h) of wild-type or PHGDH knockout (ΔPHGDH, clones #1, #2) A375 cells after MTX treatment (100 nM), cultured in 40 µM or 400 µM serine. f As in (a), but from A375 cells after treatment with the indicated concentrations of serine in serine/glycine-free growth media. g Schematic showing serine catabolism and the one-carbon folate cycle. dTMP deoxythymidinemonophosphate, THF tetrahydrofolate. h As in (a), but from A375 cells after treatment with the indicated doses of formate. i As in (a), but from A375 cells treated with veh or MTX (100 nM) in the presence or absence of SHMT1/2 inhibitor (SHIN1, 5 µM). j As in (a), but from A375 cells transfected with nontargeting controls (siCtl) or siRNA targeting MTHFD1L and treated with veh or MTX (100 nM). k Model of purine depletion stimulating de novo serine synthesis and cell migration, despite a reduced glycolytic flux and cell proliferation. a–f, h–j Data are the mean ± s.d from n = 3 (d) and n = 6 (a–c, e, f, h–j) of biologically independent samples. a–f, h–j One-way ANOVA, Turkey’s post-hoc test, multiple comparison, *p < 0.05, **p < 0.01, ***p < 0.001, ****p < 0.0001. Data are representative of n = 2 (d, j) or n = 3 (a–c, e, f, h, i) independent experiments. Western blots are representative of n = 2 (j) independent experiments. d Scale bar is indicated. Source data and exact p-values are provided as a Source Data file.

