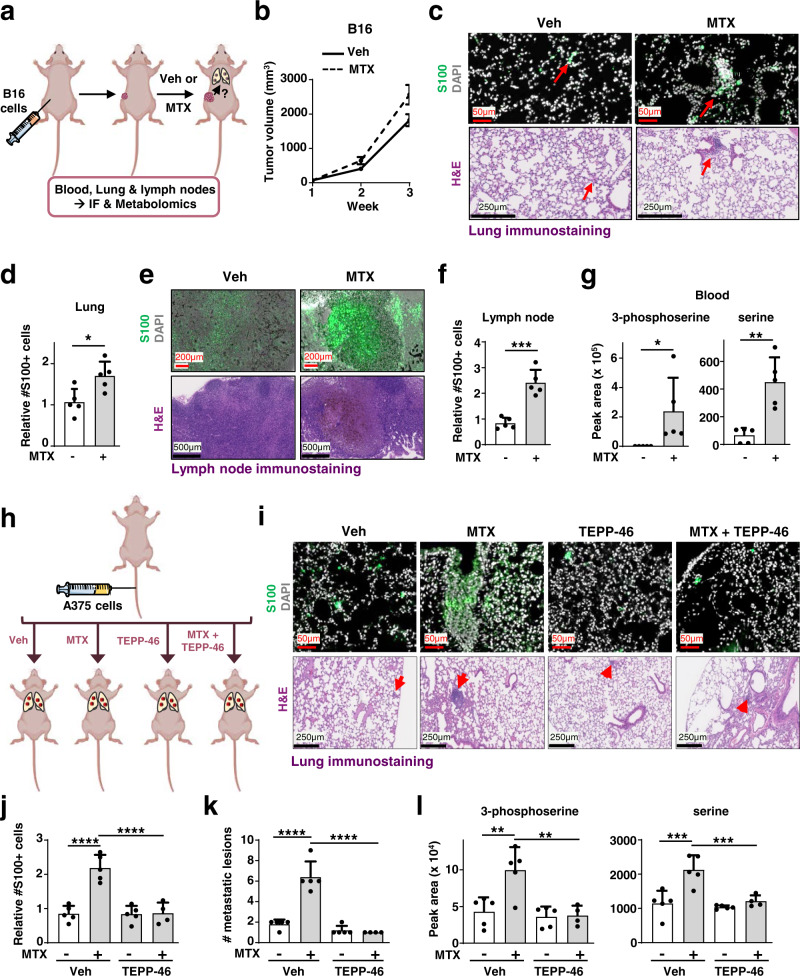
Fig. 6. Methotrexate treatment increases the metastatic capacity of melanoma cells in a PKM2-dependent manner.
a Schematic of the metastasis assay depicting subcutaneous injection of B16 melanoma cells. Mice were treated with vehicle (Veh, PBS) or MTX (20 mg/kg, three times a week) once tumors became palpable for three consecutive weeks. b Tumor growth of B16 melanoma cells. Data are presented as the mean S.D. from n= 5 animals. c Representative images of lung sections immunostained with S100 melanoma marker (green) or hematoxylin-eosin (H&E) from the experiment described in (a). d Quantification of S100 positive cells relative to vehicle control (PBS) is shown from 5 slides containing lung sections are shown. e As in (c), but from axillary lymph node stained with S100 melanoma marker (green) or H&E of experiment described in (a). f Quantification of S100 positive cells relative to vehicle control (PBS) from (e) is shown from 5 slides containing lymph sections. g Normalized peak areas of 3-phosphoserine and serine from blood. Experiment is described in (a). h Schematic of a metastasis assay depicting tail-vein injection of A375 cells in athymic nude mice. A375 cells injected into the tail vein of athymic nude mice, treated either with vehicle (PBS), or MTX (20 mg/kg, IP, three times a week), TEPP-46 (50 mg/kg, daily oral gavage), or a combination of MTX with TEPP-46. i Representative images of lung sections immunostained with S100 melanoma marker (green) or H&E are shown. n = 5 of biologically independent animals, except for n = 4 for MTX + TEPP-46 treatment. j Quantification of S100 positive cells from lung sections of the experiment in (h). k Number of metastatic lesions from H&E-stained slides containing lung sections as in (h). l Normalized peak areas of 3-phosphoserine and serine from lung tissues from experiment described in (h). b, d, f, g, j–l Data are presented as the mean ± s.d from n = 5 (b, d, f, g, j–l) of biologically independent samples. Each data point represents a distinct animal. j–l One-way ANOVA, Turkey’s post-hoc test, multiple comparison, b, d, f, g Unpaired t-test, *p < 0.05, **p < 0.01, ***p < 0.001, ****p < 0.0001. c, e, i. Scale bars are indicated. Source data and exact p-values are provided as a Source Data file.

