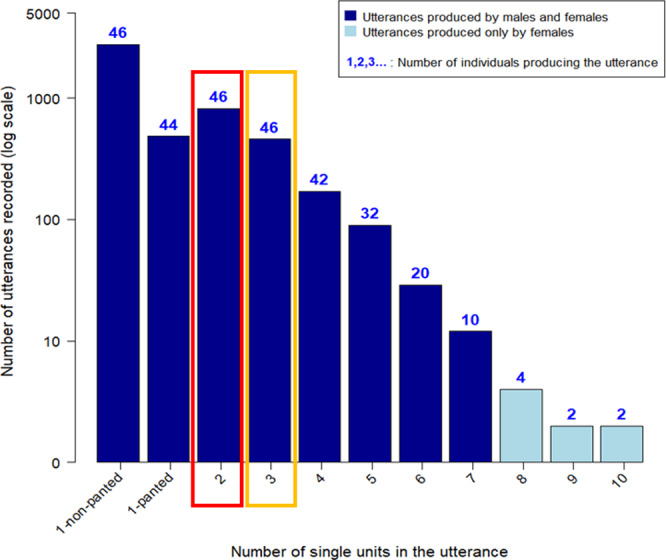
Fig. 1. Frequency distribution of vocal sequences length.

The length refers to the number of different single units. The number of single units in the utterance is indicated on the x axis. The y axis depicts the number of recordings (log-transformed for ease of visualization). All utterances with one to seven single units (in dark blue) are produced by both sexes while utterances with eight or more single units (in light blue) are only produced by females. The number on top of each bar in blue indicates the number of individuals producing utterances of this particular length. The red box indicates the data used in the bigram analysis (Figs. 2 and 3) and the orange box indicates the data used in the trigram analysis (Fig. 4).
