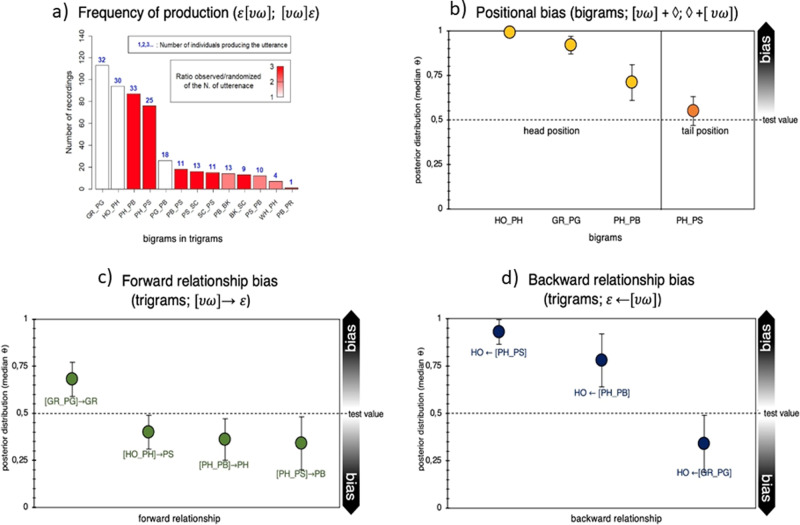
Fig. 4. Specific ordering frequency, positional bias, and relationship bias for trigrams.
a Bigrams in trigrams that were produced above chance (i.e., >95% more likely than by random juxtaposition of single units). The height of each bar corresponds to the number of times each utterance was recorded. The color gradient in the bars depicts the number of times each utterance was observed divided by the number of times each utterance was present on average in each randomization (averaged over 1000 randomizations). The color ranges from the lowest ratio in white (i.e., the utterance was present in the observed data two times more than in the randomization) to the highest ratio in red (i.e., the utterance was present in the observed data 13 times more than in the randomized data). The number on top of each bar in blue indicates the number of individuals that produced each utterance. b Likelihood for a certain bigram to occur in head position (yellow) or in tail position (red) in trigrams, expressed as median posterior distribution (θ). Bars stand for Credible Intervals (CI) at 95%. ♢ = irrespective of unit type (see Table 4). c Likelihood for a certain bigrams to be in a forward relationship (green) with a certain single unit following it (see Table 4). d Likelihood for a certain bigram to be in a backward relationship (blue) with a certain single unit following it (see Table 4). *The bigram PB_PR appeared in the dataset only 1 time and it appeared 250 times less in the randomizations as compared to the observed frequency (i.e., it appeared only 22 times in 1000 randomization so at an average frequency of 0.022), and not 3 times as indicated by the red color. We used a gradient of color from 1 to 3 to visualize the variation in the other bigrams bearing in mind that the ratio observed/randomized of the last bigram (PB_PR) is much higher than indicated in the figure.

