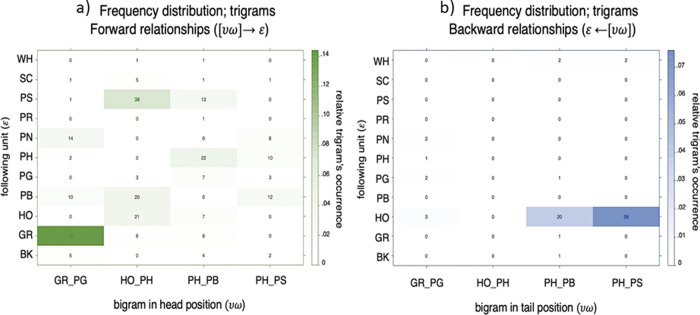
Fig. 5. Frequency distribution for bigrams within trigrams.
a Bigrams occurring in head position along the x axis and subsequent units along the y axis. Color gradients (white-to-green) represent the relative occurrence of each bigram within the trigram’ set. In each cell, the absolute frequency count for each three-unit sequence is also reported. b Frequency distribution for trigrams with bigrams occurring in tail position along the x axis and preceding units along the y axis. Color gradients (white-to-blue) represent the relative occurrence of each bigram within the trigram’ set. In each cell, the absolute frequency count for each trigrams is also reported.

