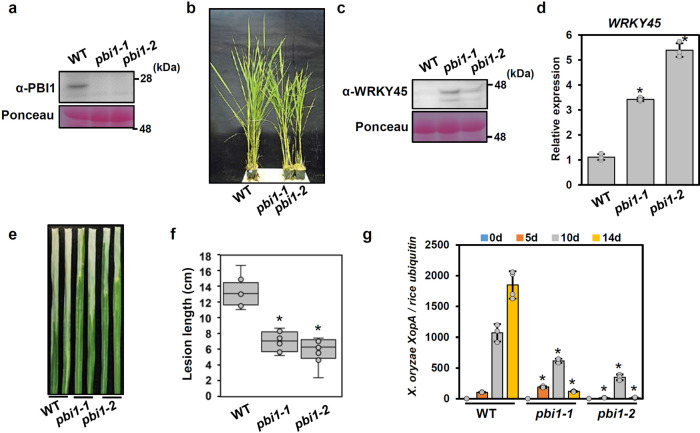
Fig. 5. PBI1 negatively regulates disease resistance through WRKY45.
a PBI1 protein levels in leaves of the pbi1-knockout (ko) mutants pbi1-1 and pbi1-2 were analyzed by immunoblotting with α-PBI. b Phenotypes of the pbi1-ko mutants. c WRKY45 protein levels in leaves of the pbi1-ko mutants, analyzed by immunoblotting with α-WRKY45. d WRKY45 transcripts level in leaves of the pbi1 mutants, analyzed by quantitative real-time PCR. Error bars indicates ±SD. n = 3 biologically independent replicates. Asterisks indicate significant differences between the WT and the pbi1 mutants (two-sided Student’s t-test P < 0.01). e Rice leaves were infected with Xoo T7174 using a crimping method. The photograph of disease lesions was taken at 14 dpi. Scale bar = 1 cm. f Mean lengths of disease lesions at 25 dpi. The box plots show the first and third quartiles as bounds of box, split by the medians (lines), with whiskers extending 1.5-fold interquartile range beyond the box, and minima and maxima as error bar. Error bars indicate ±SD. n = 8 biologically independent samples. Asterisks indicate significant differences between the WT and the pbi1 mutants (two-sided Student’s t-test P < 0.01). g The bacterial populations of Xoo T7174 were analyzed by quantitative real-time PCR. The data indicate the DNA levels of the X. oryzae XopA gene relative to that of the rice ubiquitin gene. Error bars indicate ±SD. n = 4 biologically independent replicates. Asterisks indicate significant differences between the WT and the pbi1 mutants (two-sided Student’s t-test P < 0.01). The experiments in (a) and (c–g) were repeated three times with similar results.

