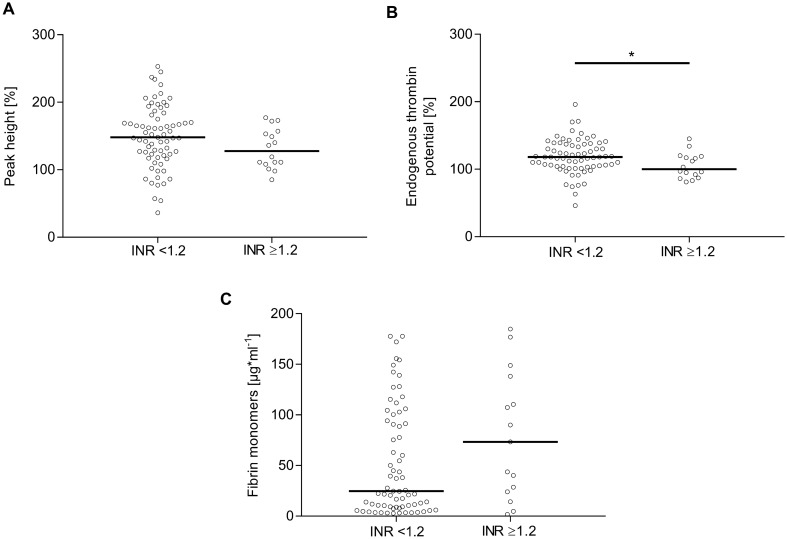
Fig. 2.
Analysis of thrombin activity and generation in plasma of patients with iTBI stratified by INR. Peak height (A), endogenous thrombin potential (B), and fibrin monomers (C) were measured after iTBI by using calibrated automated thrombography. Statistically significant differences between patients with iTBI with INR < 1.2 and patients with iTBI with INR ≥ 1.2 are marked with asterisks (*P < 0.05, **P < 0.001, ***P < 0.0001). INR international normalized ratio, iTBI isolated traumatic brain injury

