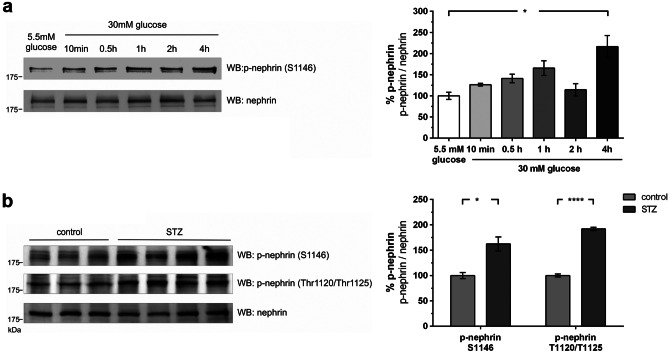
Fig. 4.
Phosphorylation of nephrin serine 1146 in murine podocytes and nephrin serine 1146 and threonine 1120/1125 in diabetic mice (molecular mass markers are indicated in kilodalton (kDa)). a Western blot analysis of phosphorylation of nephrin serine 1146 in immortalized murine podocytes under low (5.5 mM) and high glucose (30 mM) conditions at given time points (n = 4 each). The results were quantified by densitometry and graphed as phospho-nephrin (p-nephrin) to total nephrin (nephrin) ratio–normoglycemic (5.5 mM) group was normalized to 100%. A total of 5.5 mM glucose vs. 30 mM glucose 4 h: 100.0 ± 8.4 vs. 216.4 ± 26.4% (*p < 0.05). b Western blot analysis of phosphorylation of nephrin serine 1146 and threonine 1120/1125 in nondiabetic (control) and diabetic (STZ) mice (day 5)–control was normalized to 100%: S1146 control (n = 3) vs. STZ (n = 4): 100.0 ± 6.0 vs. 162.2 ± 13.8% (*p < 0.05); T1120/1125 control (n = 3) vs. STZ (n = 4): 100.0 ± 2.9 vs. 191.9 ± 3.2% (****p < 0.0001)

