Fig. 6.
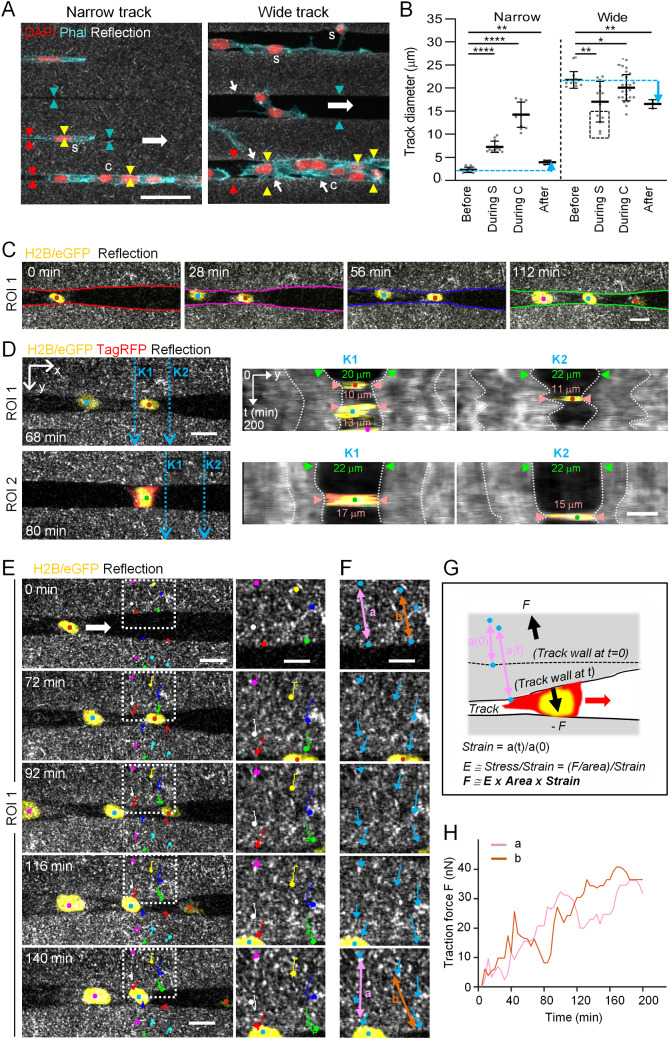
Quantification of HT1080 cell-induced collagen deformation during microtrack migration. All cells migrated within collagen-ablated wide tracks with a general migration direction from left to right. (A) Single cells (s) and cell clusters (c) migrating in tracks of indicated widths. Arrowheads, visualization of track boundaries before (cyan), during (yellow) and after (red) cell passage; note the equal distance between arrowheads along the track length. Small white arrows indicate collagen densification. (B) Track widths before, during (’During S’, during single cell transmigration; ’During C’, during collective cell transmigration) or after cell passage of narrow or wide tracks. Data represent 3-27 measurements (dots) per condition (N=2). Solid line with whiskers, mean and SD. Cyan dotted lines, initial track diameter. Cyan arrow indicates difference between track diameter before and after cell transmigration. Black dotted rectangle, deformed track diameters by single cells attaching to both track walls. Kruskal-Wallis test with Dunn’s multiple comparisons test. *, p -value < 0.05; **, p -value < 0.01; ****, p-value < 0.0001. (C-F) 3D timelapse confocal microscopy of cell-induced track deformation, where 80 m stacks with 5 mm step sizes were taken at 4-min time intervals. Each of the three different cell nuclei is color-coded by dots throughout these panels. (C) Imaging sequence taken from a plane in the middle of a track at indicated time points, corresponding to the upper part (ROI1) of Movie 1. Color-coded lines indicate track wall deformation. (D) Kymograph analysis from two image sequences from the upper (ROI1) and lower (ROI2) part of Movie 1. From the x-positions K1 and K2 of both ROIs (left, blue dotted arrows), track deformation over time is shown (K1, middle; K2, right). White dotted lines show deformation of the collagen as a function of time (vertical axis). (E) Tracking of the local collagen speckle pattern (colored dots and lines) over time. Dotted rectangle depicts region of zoom-in on the right, demonstrating that collagen displacement is increasing towards the track edge (compare long red and green with short pink and yellow colored trajectories). (F) Strain analysis by cell-induced change of collagen speckle distance over time. Blue arrows, magnitude and direction of collagen displacement with respect to the first time point (0). Colored double arrows a and b in upper and lower image indicate increased distance between track edge and speckle-like positions within the collagen after cell passage. (G) Cartoon depicting collagen deformation (strain) by transmigrating cell and calculation principle of cell-derived traction force onto collagen leading to track deformation. The depicted formulas are applied for the calculation of traction force F. (H) Quantification of F on the track wall over time. Scale bars: 50 m (A), 20 m (C; D and E, left), 10 m (D and E, right; F)

