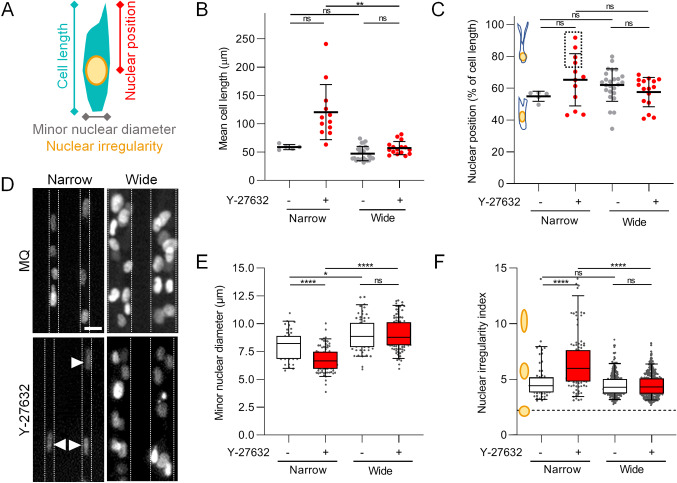
Fig. 8.
Cell and nuclear morphology in microtracks in the absence or presence of Y-27632. A Schematics depicting cellular and nuclear parameters analyzed. B Quantification of mean cell length over time at indicated conditions. C Quantification of mean nuclear position over time calculated as percentage of cell length over time. Dotted box indicates cells in which the nucleus located at cell rear, as indicated in the drawing. (B,C) Data represent mean value of 5-25 cells (dots) per condition over 3-13 hours (N=1). Solid line with whiskers, mean and SD. D Image of fluorescent nuclear H2B-mCherry signal at indicated conditions. Dotted lines indicate track walls, arrowheads indicate strongly deformed nuclei. E, F Quantification of minor nuclear diameter (E) or nuclear irregularity index (F) at indicated conditions. Horizontal lines and boxes and whiskers show the medians, 25th/75th, and 5th/95th percentile. Dots show individual measurements outside of the 25th to 75th percentile. Data represent 42-105 nuclei per condition (E), or 63-439 nuclei per condition, each from 2 experiments (F). B, C, E, F Kruskal-Wallis test with Dunn’s multiple comparisons test; ns, not significant; *, p-value ; **, p-value ; ****, p-value . Scale bar: 20 m

