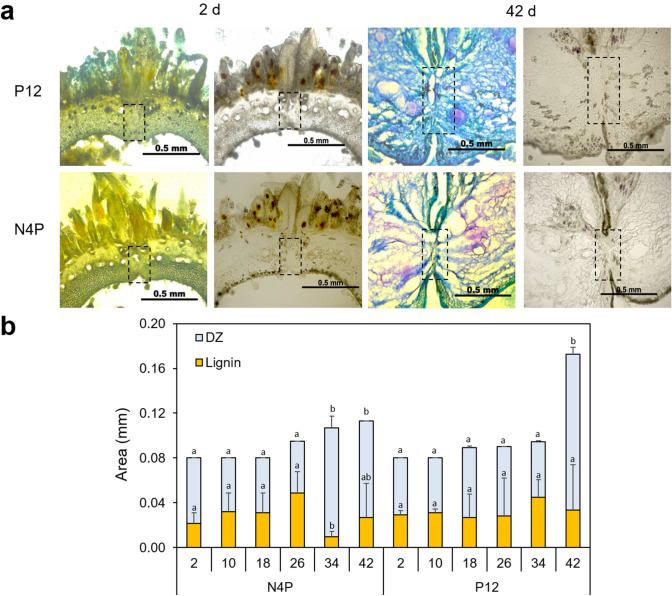
Fig. 2.
Increase in the dehiscence zone (DZ) during fruit development in the accessions P12 (indehiscent) and N4P (dehiscent) of B. orellana. a Contrasting fruit development stages (2 d and 42 d) after staining with blue toluidine (left) and PHCL (right), showing the DZ (dotted rectangles). b Increased DZ (blue bars) and PHCL staining areas (orange bars) indicate the lignification process. Numbers on the X-axis indicate the days (d) after floral anthesis (DAFA), and Numbers on the Y-axis indicate the area in mm. a and b indicate the minimum significant difference for each group (significance of 0.05 with the Tukey test)

