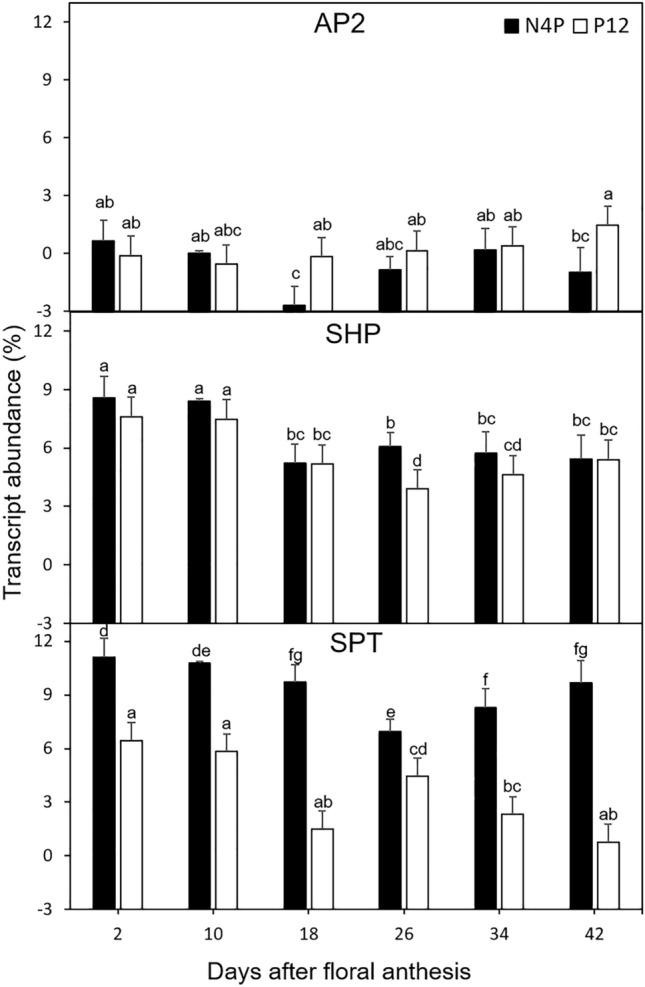
Fig. 5.

Global expression of dehiscent-related genes in dehiscent N4P (black) and indehiscent P12 accessions (white) at 2, 10, 26, 34, and 42 d after floral anthesis. a, b, c, d, e, f, and g indicate the minimum significant difference for each group (significance of 0.05 with the Tukey test)
